Systematic Equity Ranking Model
A multi-factor quantitative model that scores, ranks, and constructs a concentrated long-only equity portfolio. Designed for participants who want a structured, repeatable framework for identifying the strongest long positions across a broad equity universe.
How Quant Long-Only Works
Quant Long-Only is built on a simple principle: systematically identify the securities with the strongest quantitative characteristics and hold a concentrated portfolio of the top-ranked names. The model combines multiple independent signal families into a composite scoring framework, rebalances on a defined schedule, and tracks performance with institutional-grade analytics.
Universe Definition & Filtering
The model operates across a defined equity universe that is filtered for liquidity, market capitalization, and data quality. Securities that fail minimum thresholds are excluded before any scoring takes place, ensuring the output is actionable — every name in the ranked list can actually be traded at meaningful size without market impact concerns.
Multi-factor Scoring Framework
Each qualifying security is evaluated across several independent signal families. These include momentum signals (trend strength, acceleration, and relative performance), quality metrics (profitability, balance sheet stability, and earnings consistency), value indicators (relative valuation across multiple dimensions), and risk-adjusted measures (Sharpe-like characteristics and downside protection behavior). The signals are combined into a composite score that reflects the overall quantitative attractiveness of each security.
Portfolio Construction
The top-ranked securities are assembled into a concentrated portfolio using a weighting methodology that reflects conviction from the scoring framework while respecting diversification constraints. The model enforces position limits, sector concentration bounds, and turnover controls to keep the portfolio investable and aligned with the risk budget. Cash is held when insufficient candidates meet the quality threshold.
Rebalancing Discipline
The portfolio rebalances on a defined schedule, comparing the current book to the new target allocation. The rebalance output includes which positions are added, removed, and resized, along with the scoring metrics that drove each decision. This transparency allows subscribers to understand the model's reasoning without needing to reverse-engineer the signal weights.
Performance Tracking & Attribution
The model tracks a daily NAV series from inception, computing returns net of the defined rebalance frequency. Performance is benchmarked against SPY and decomposed into factor attribution, sector contribution, and individual position impact. Risk metrics including drawdown depth, rolling volatility, and rolling Sharpe are computed continuously.
What Subscribers Receive
Subscribers access a live dashboard with five core views: an overview with NAV and KPIs, a portfolio tab with current holdings and sector breakdown, a backtest view with historical performance, a risk tab with rolling analytics, and a rebalance tab with the latest model output. The dashboard updates with live intraday P&L during market hours and refreshes the full model output after each rebalance.
What You See as a Subscriber
The Quant Long-Only dashboard is a live application with five interactive views covering every aspect of the model's output.
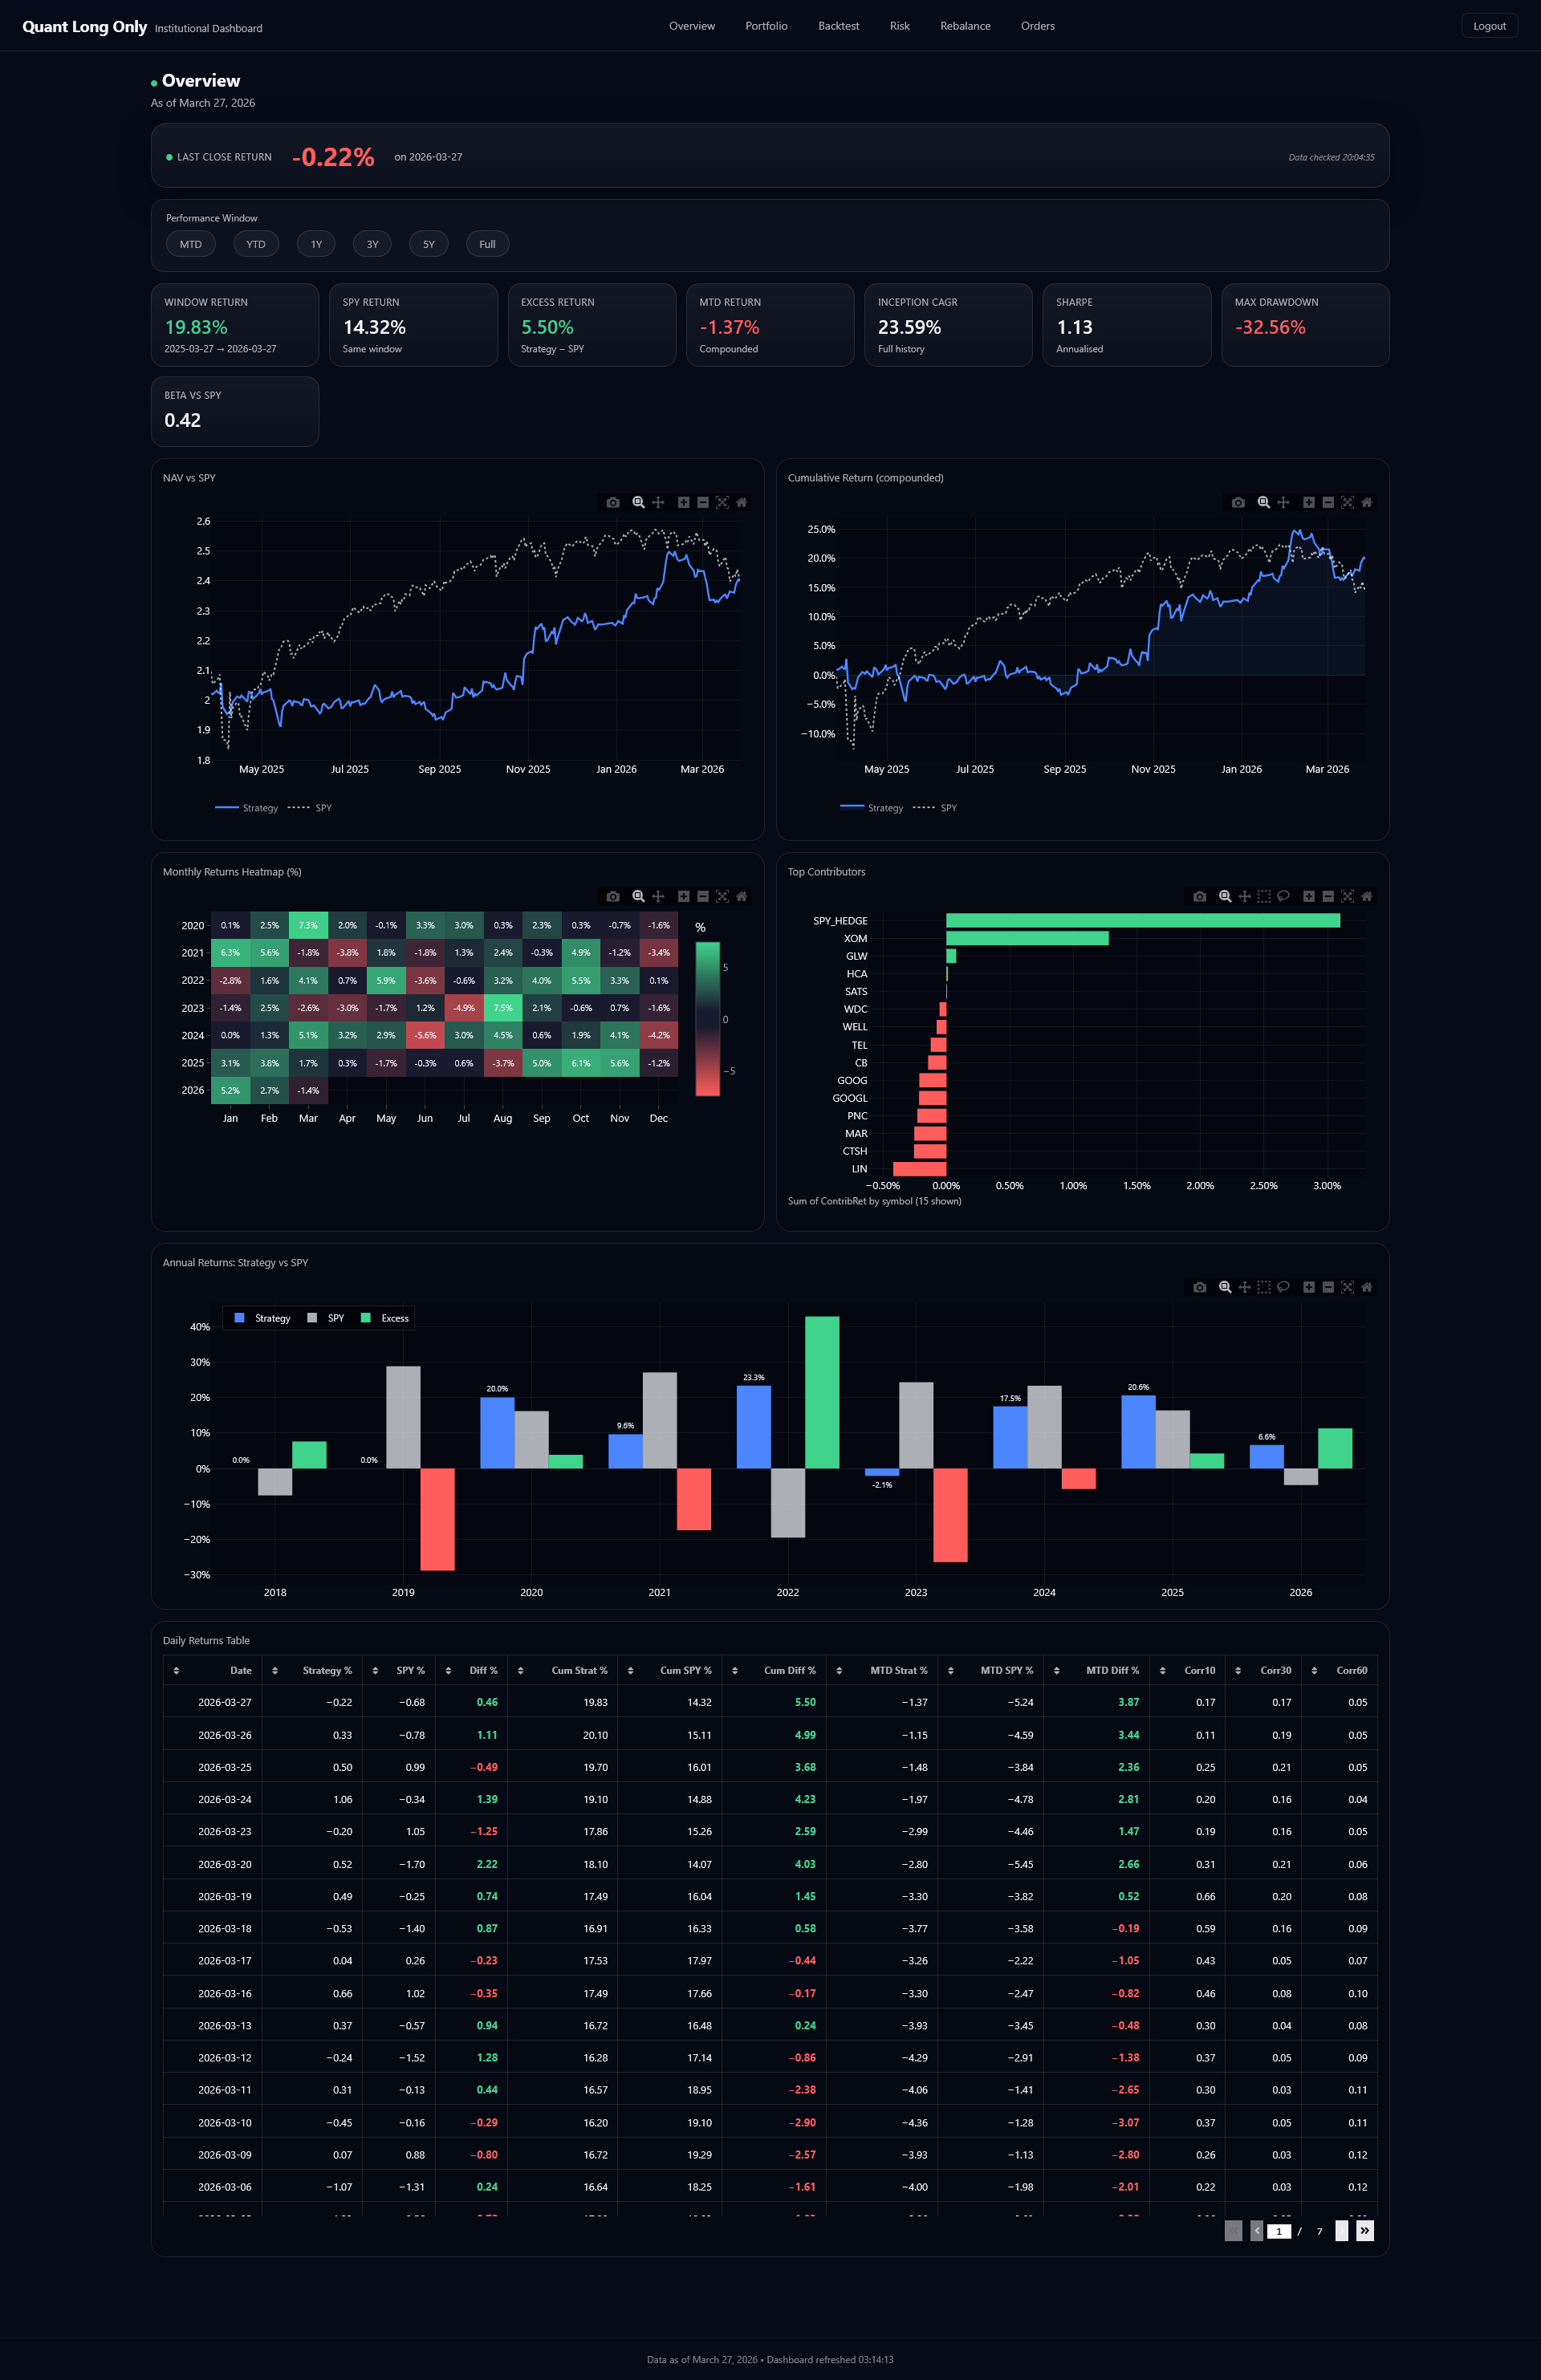
Overview
Last close return, selectable performance windows (MTD through Full), KPI row with window return, SPY return, excess, MTD, inception CAGR, Sharpe, max drawdown, and beta. NAV vs SPY chart, cumulative return comparison, monthly return heatmap, top contributors bar chart, annual returns vs SPY, and paginated daily returns table.
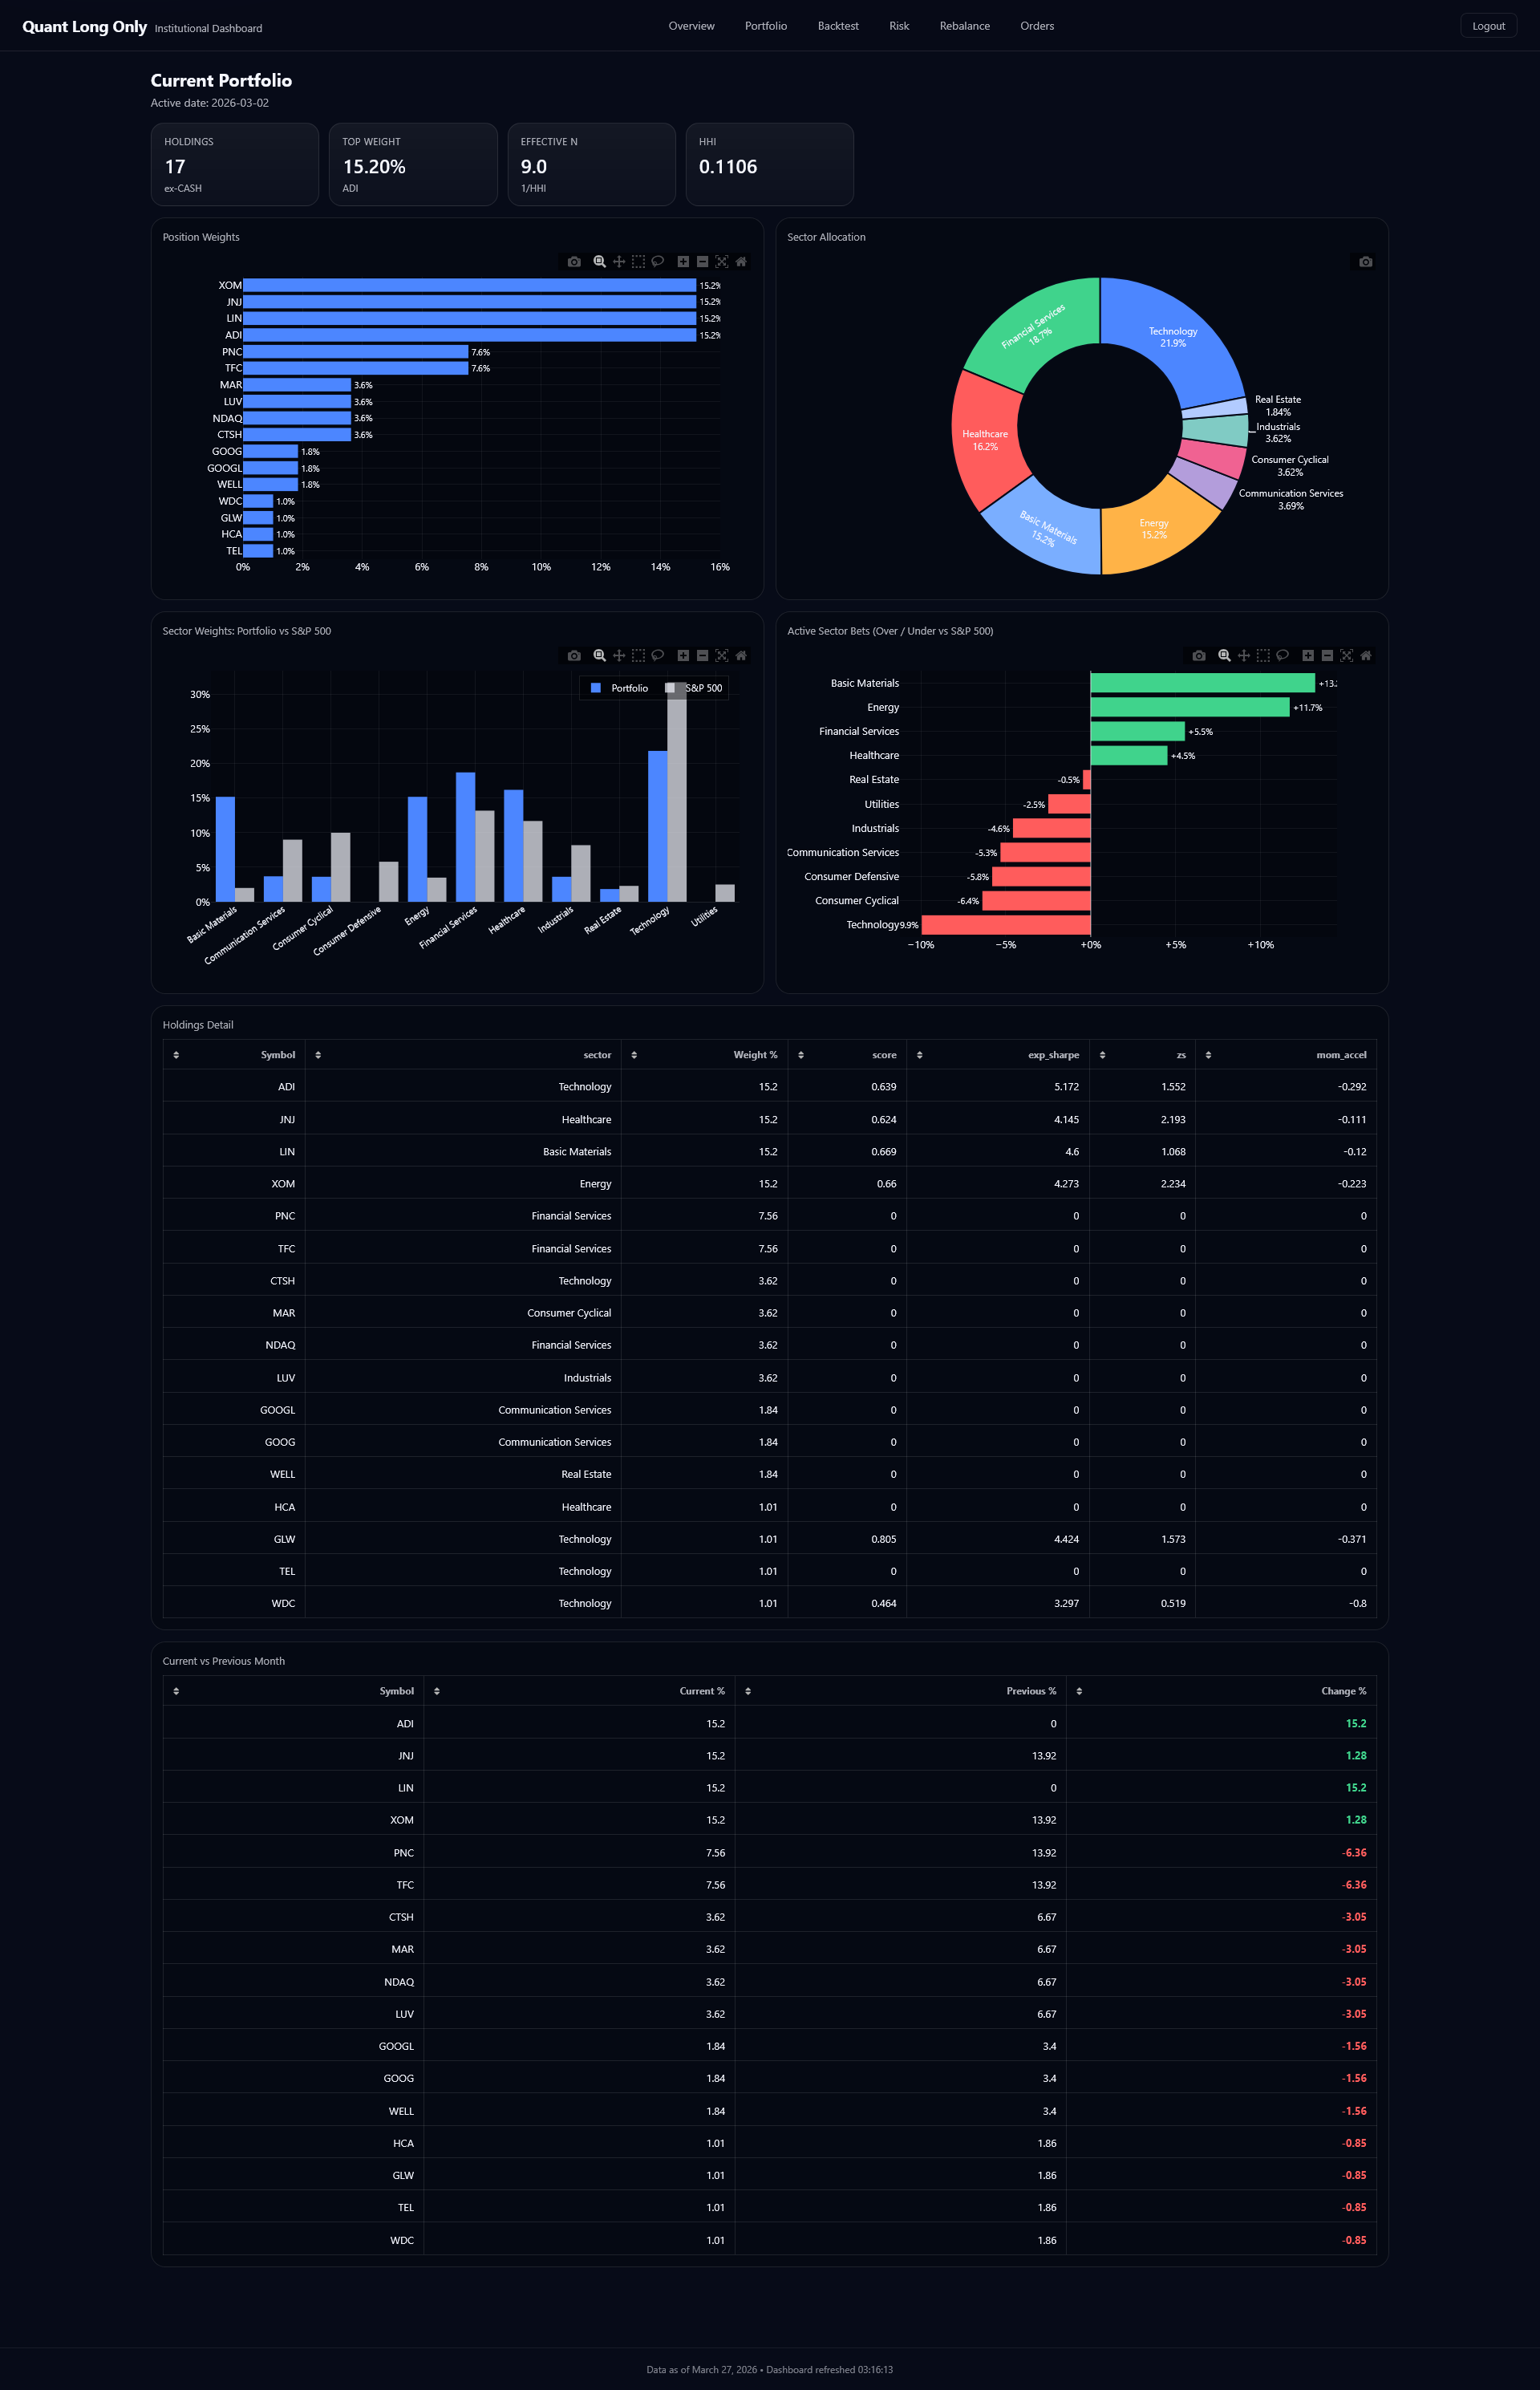
Portfolio
Current holdings count, top weight, effective N, and HHI concentration. Position weights bar chart, sector allocation donut, sector weights vs S&P 500 comparison, active sector bets (over/under), full holdings detail table with score, expected Sharpe, and momentum acceleration, plus current vs previous month weight changes.
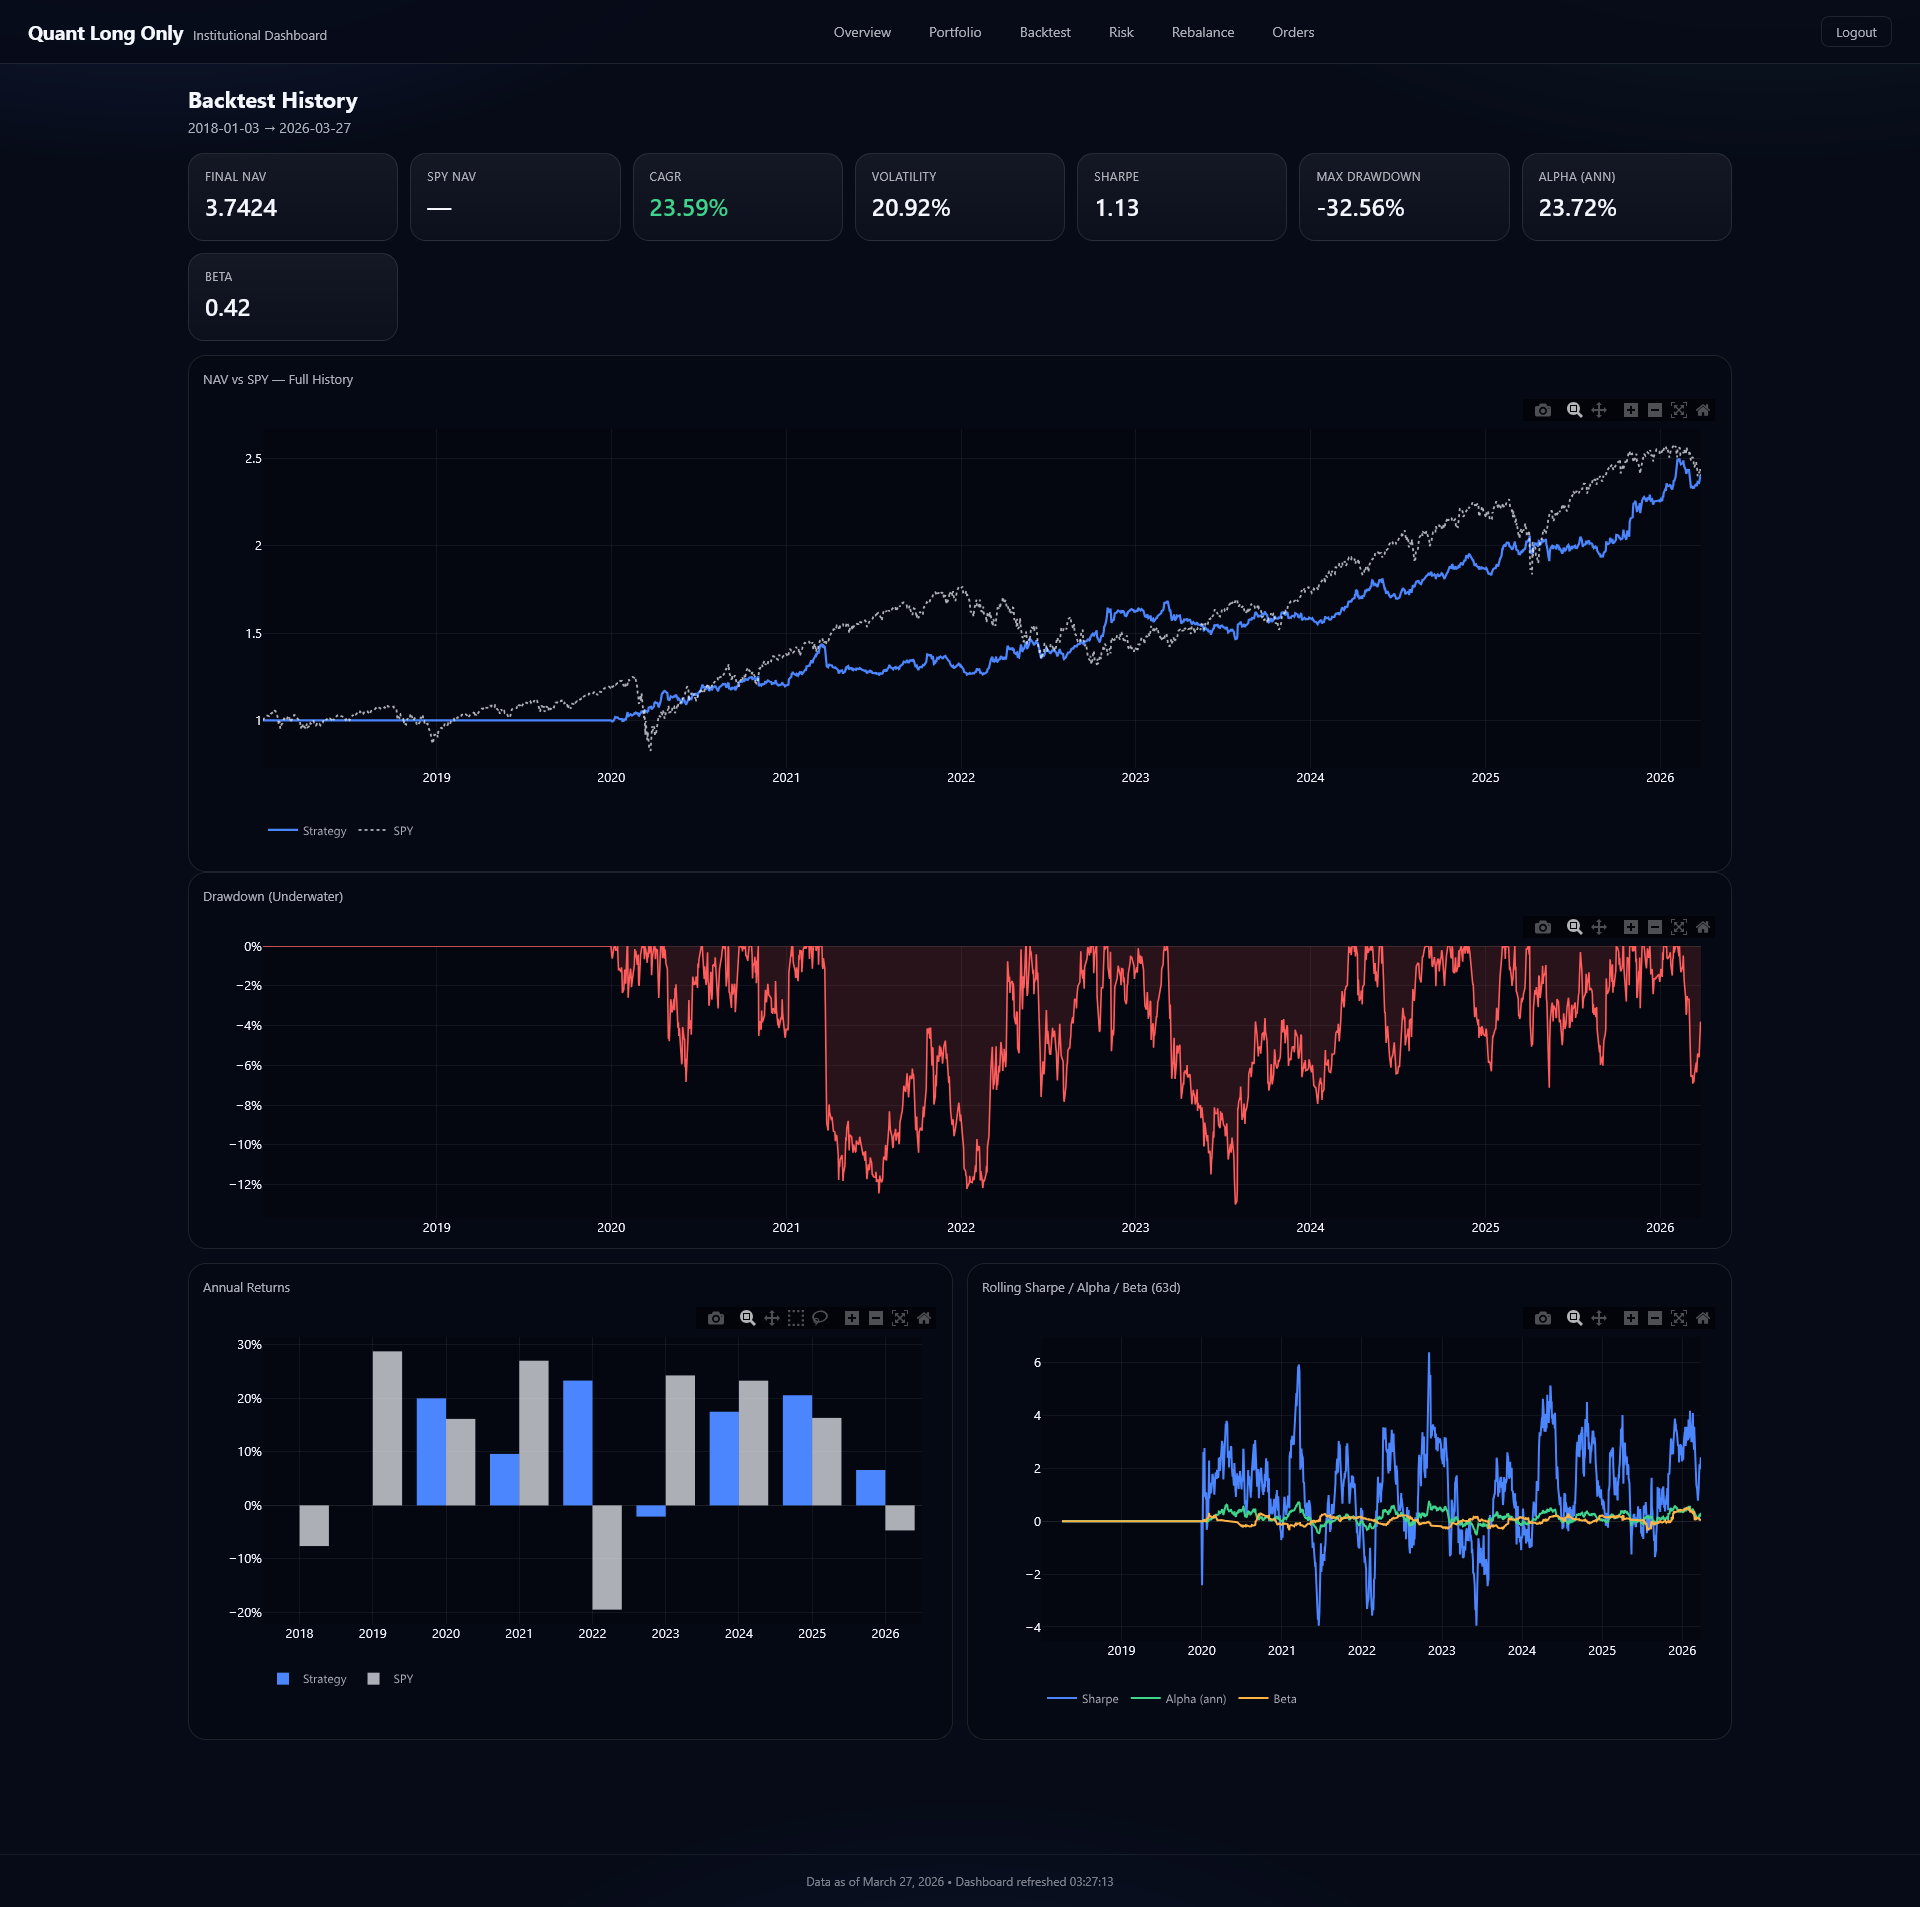
Backtest
Full history from 2018 with final NAV, CAGR, volatility, Sharpe, max drawdown, alpha, and beta KPIs. NAV vs SPY equity curve, drawdown underwater chart, annual return bars (strategy vs SPY with excess), and rolling Sharpe / alpha / beta over 63-day windows.
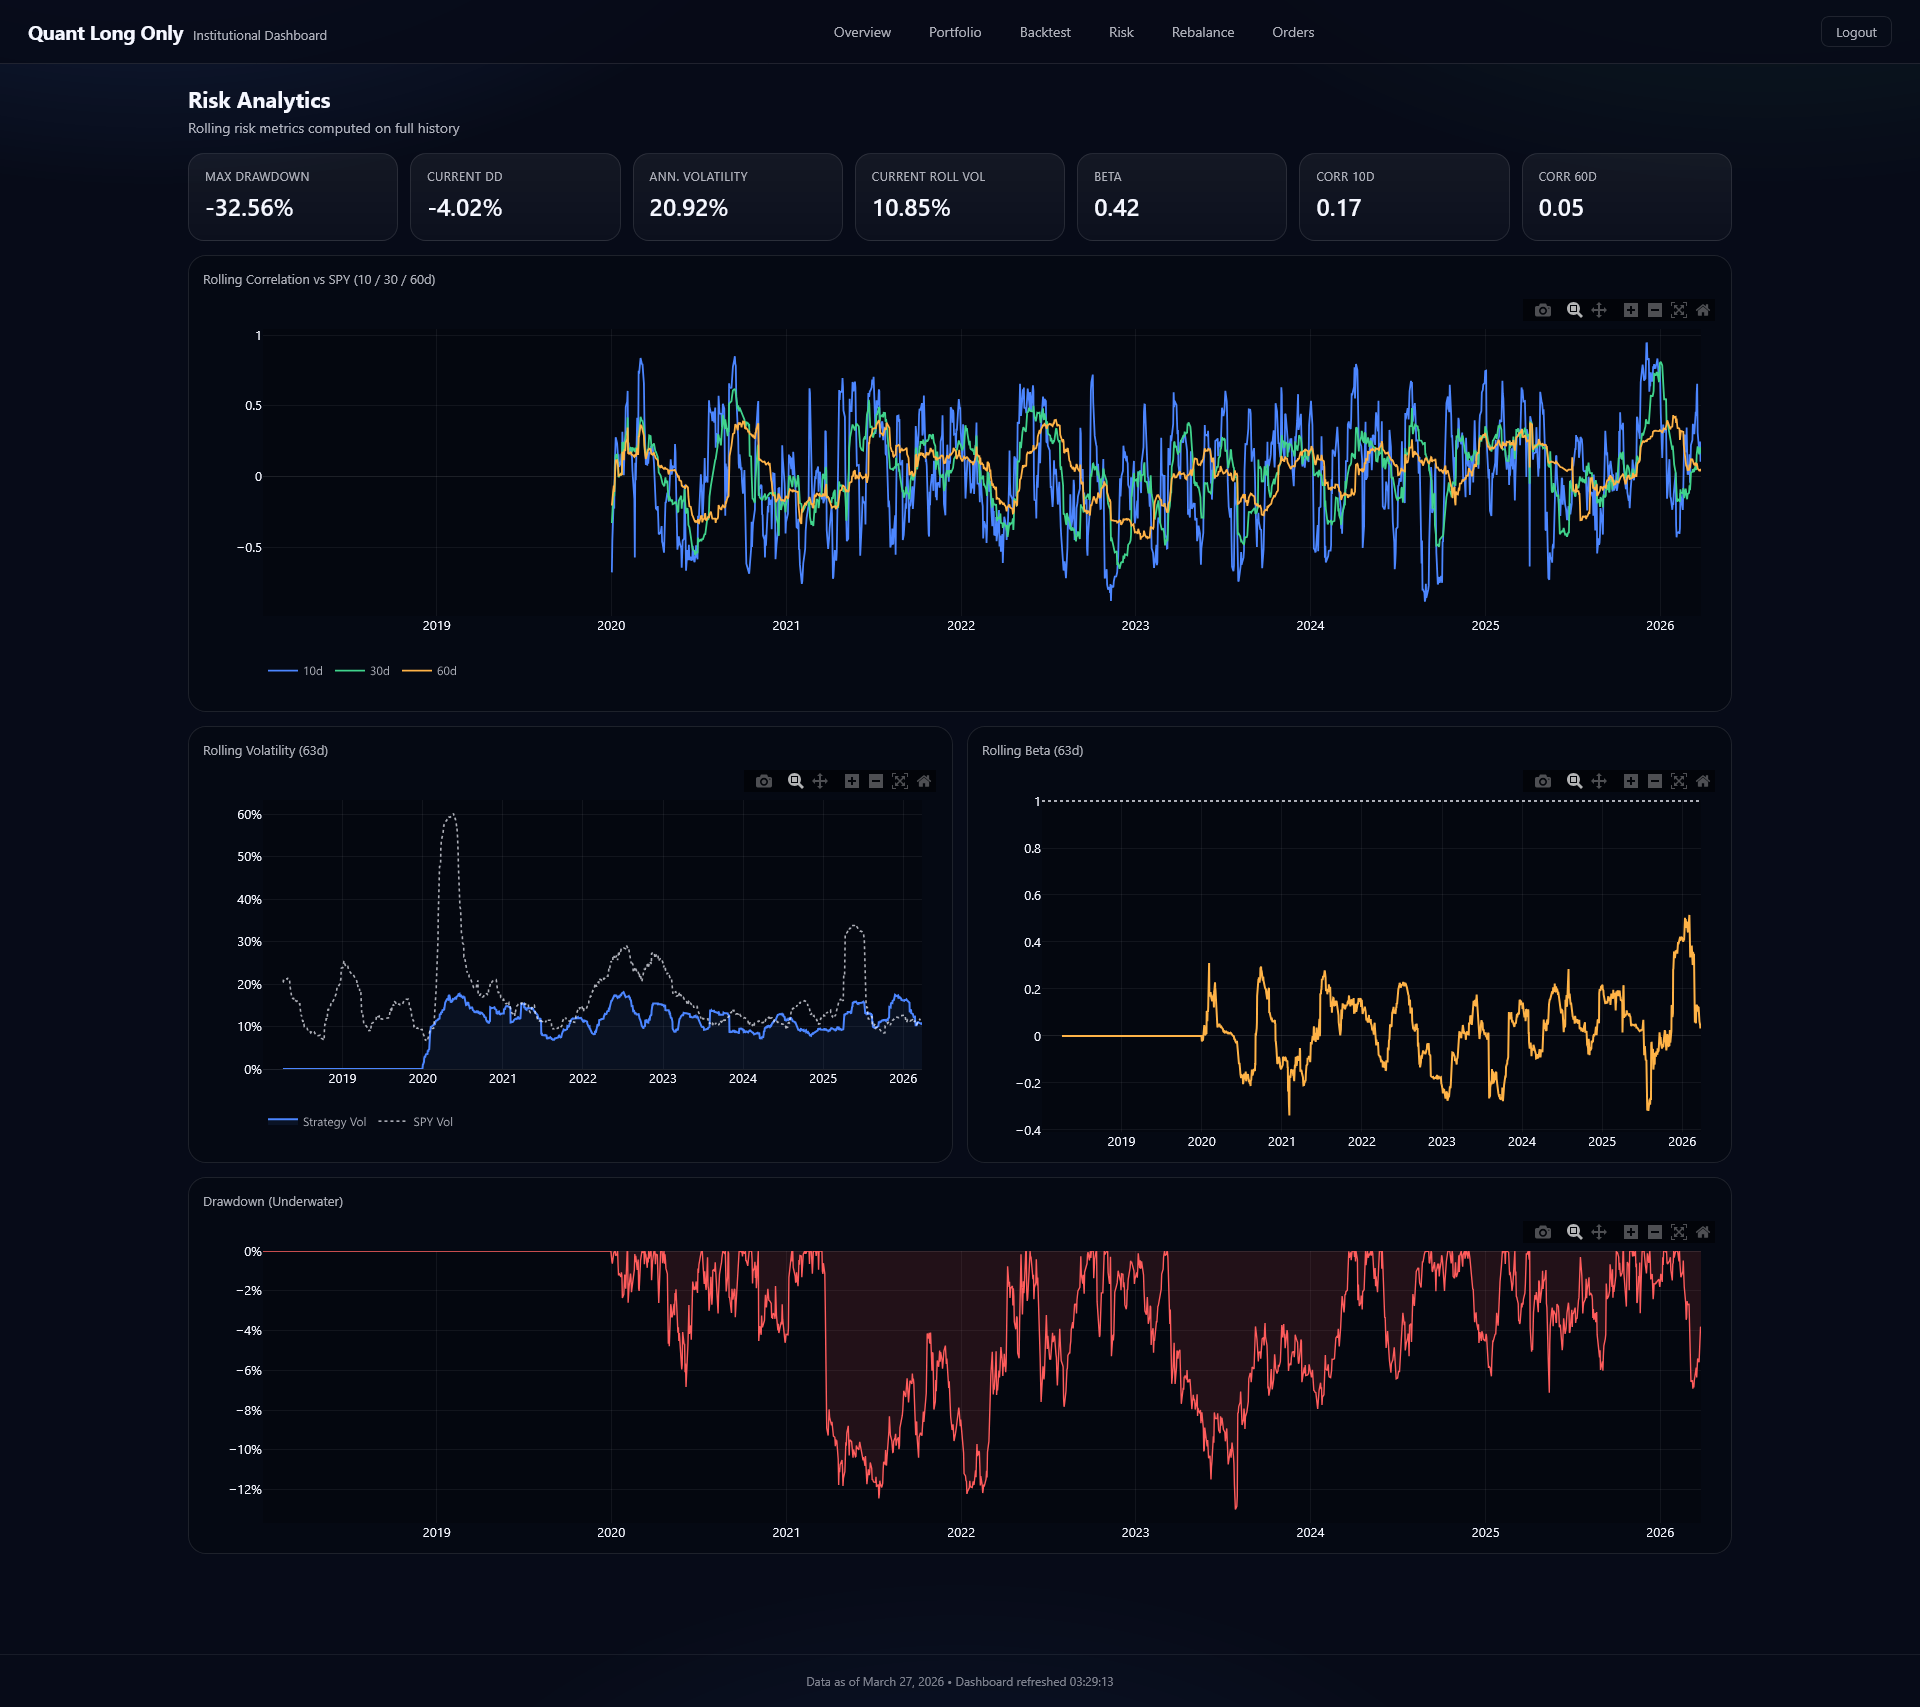
Risk
Max drawdown, current drawdown, annualized volatility, current rolling vol, beta, and multi-window correlations (10d, 60d). Rolling correlation vs SPY across three windows, rolling volatility (strategy vs SPY), rolling beta chart, and full drawdown underwater history.
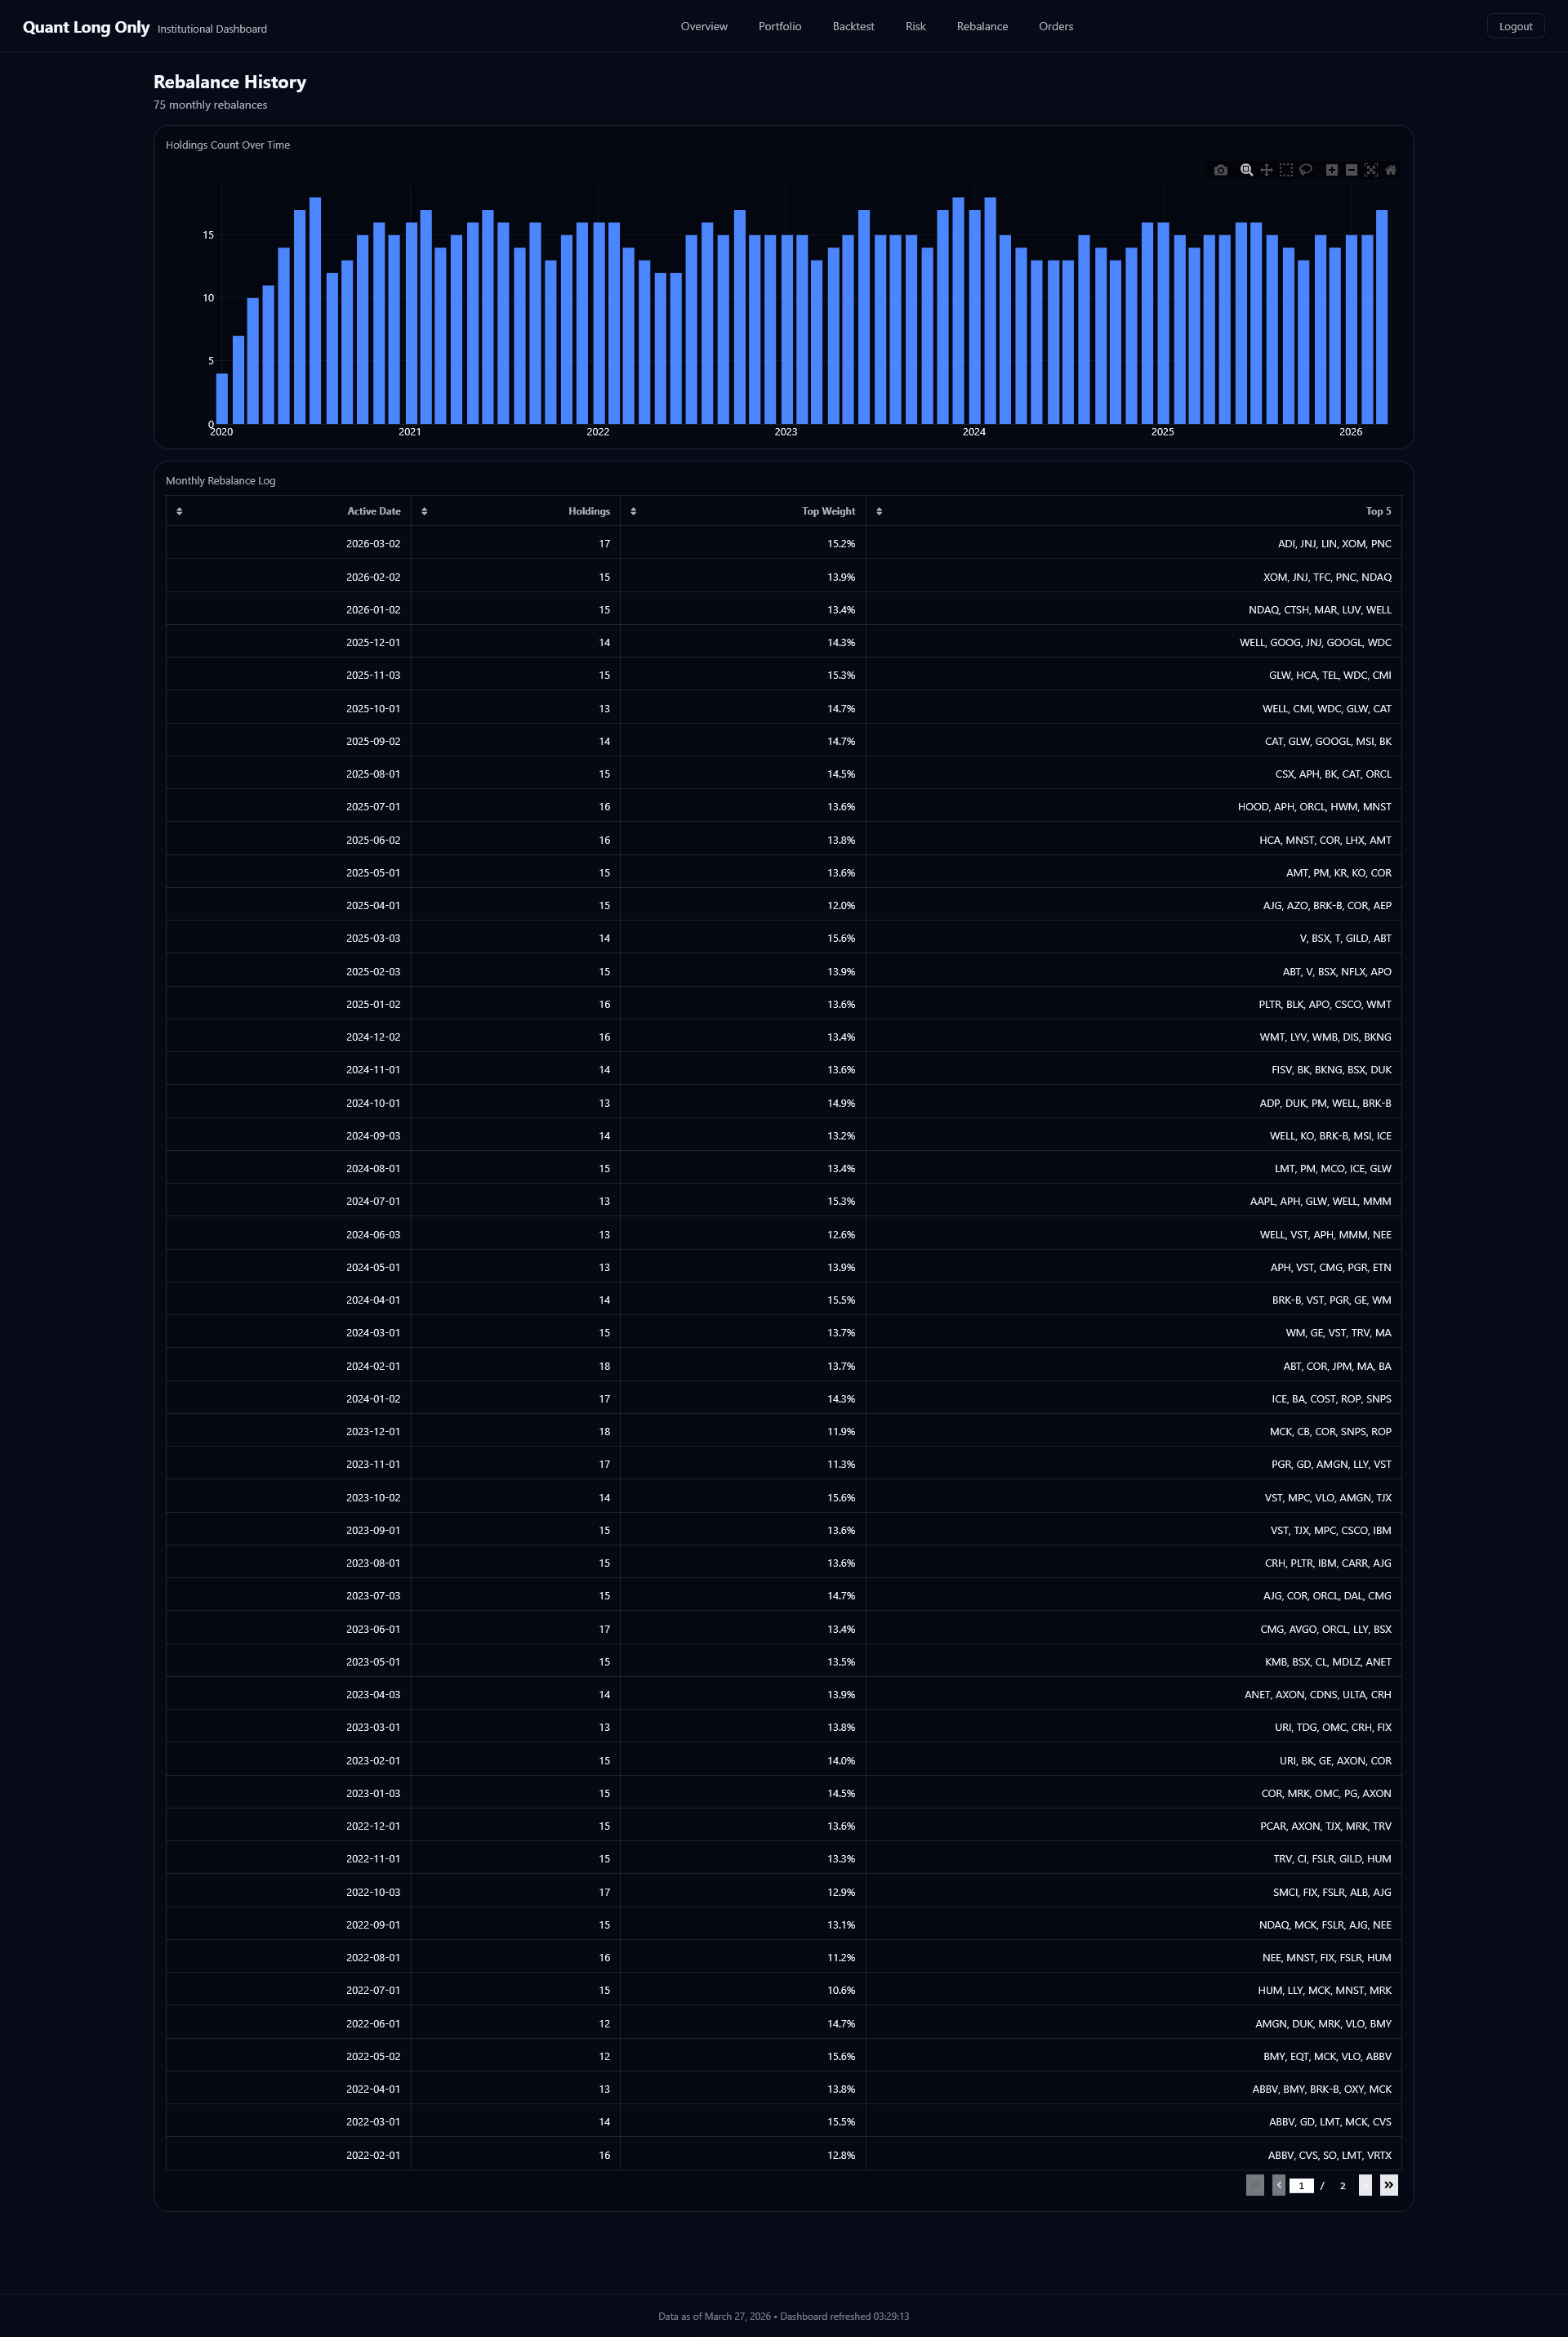
Rebalance
Complete rebalance history with 71+ monthly rebalances. Holdings count over time chart, and full monthly log showing active date, number of holdings, top weight, and top 5 names for every rebalance period back to inception.
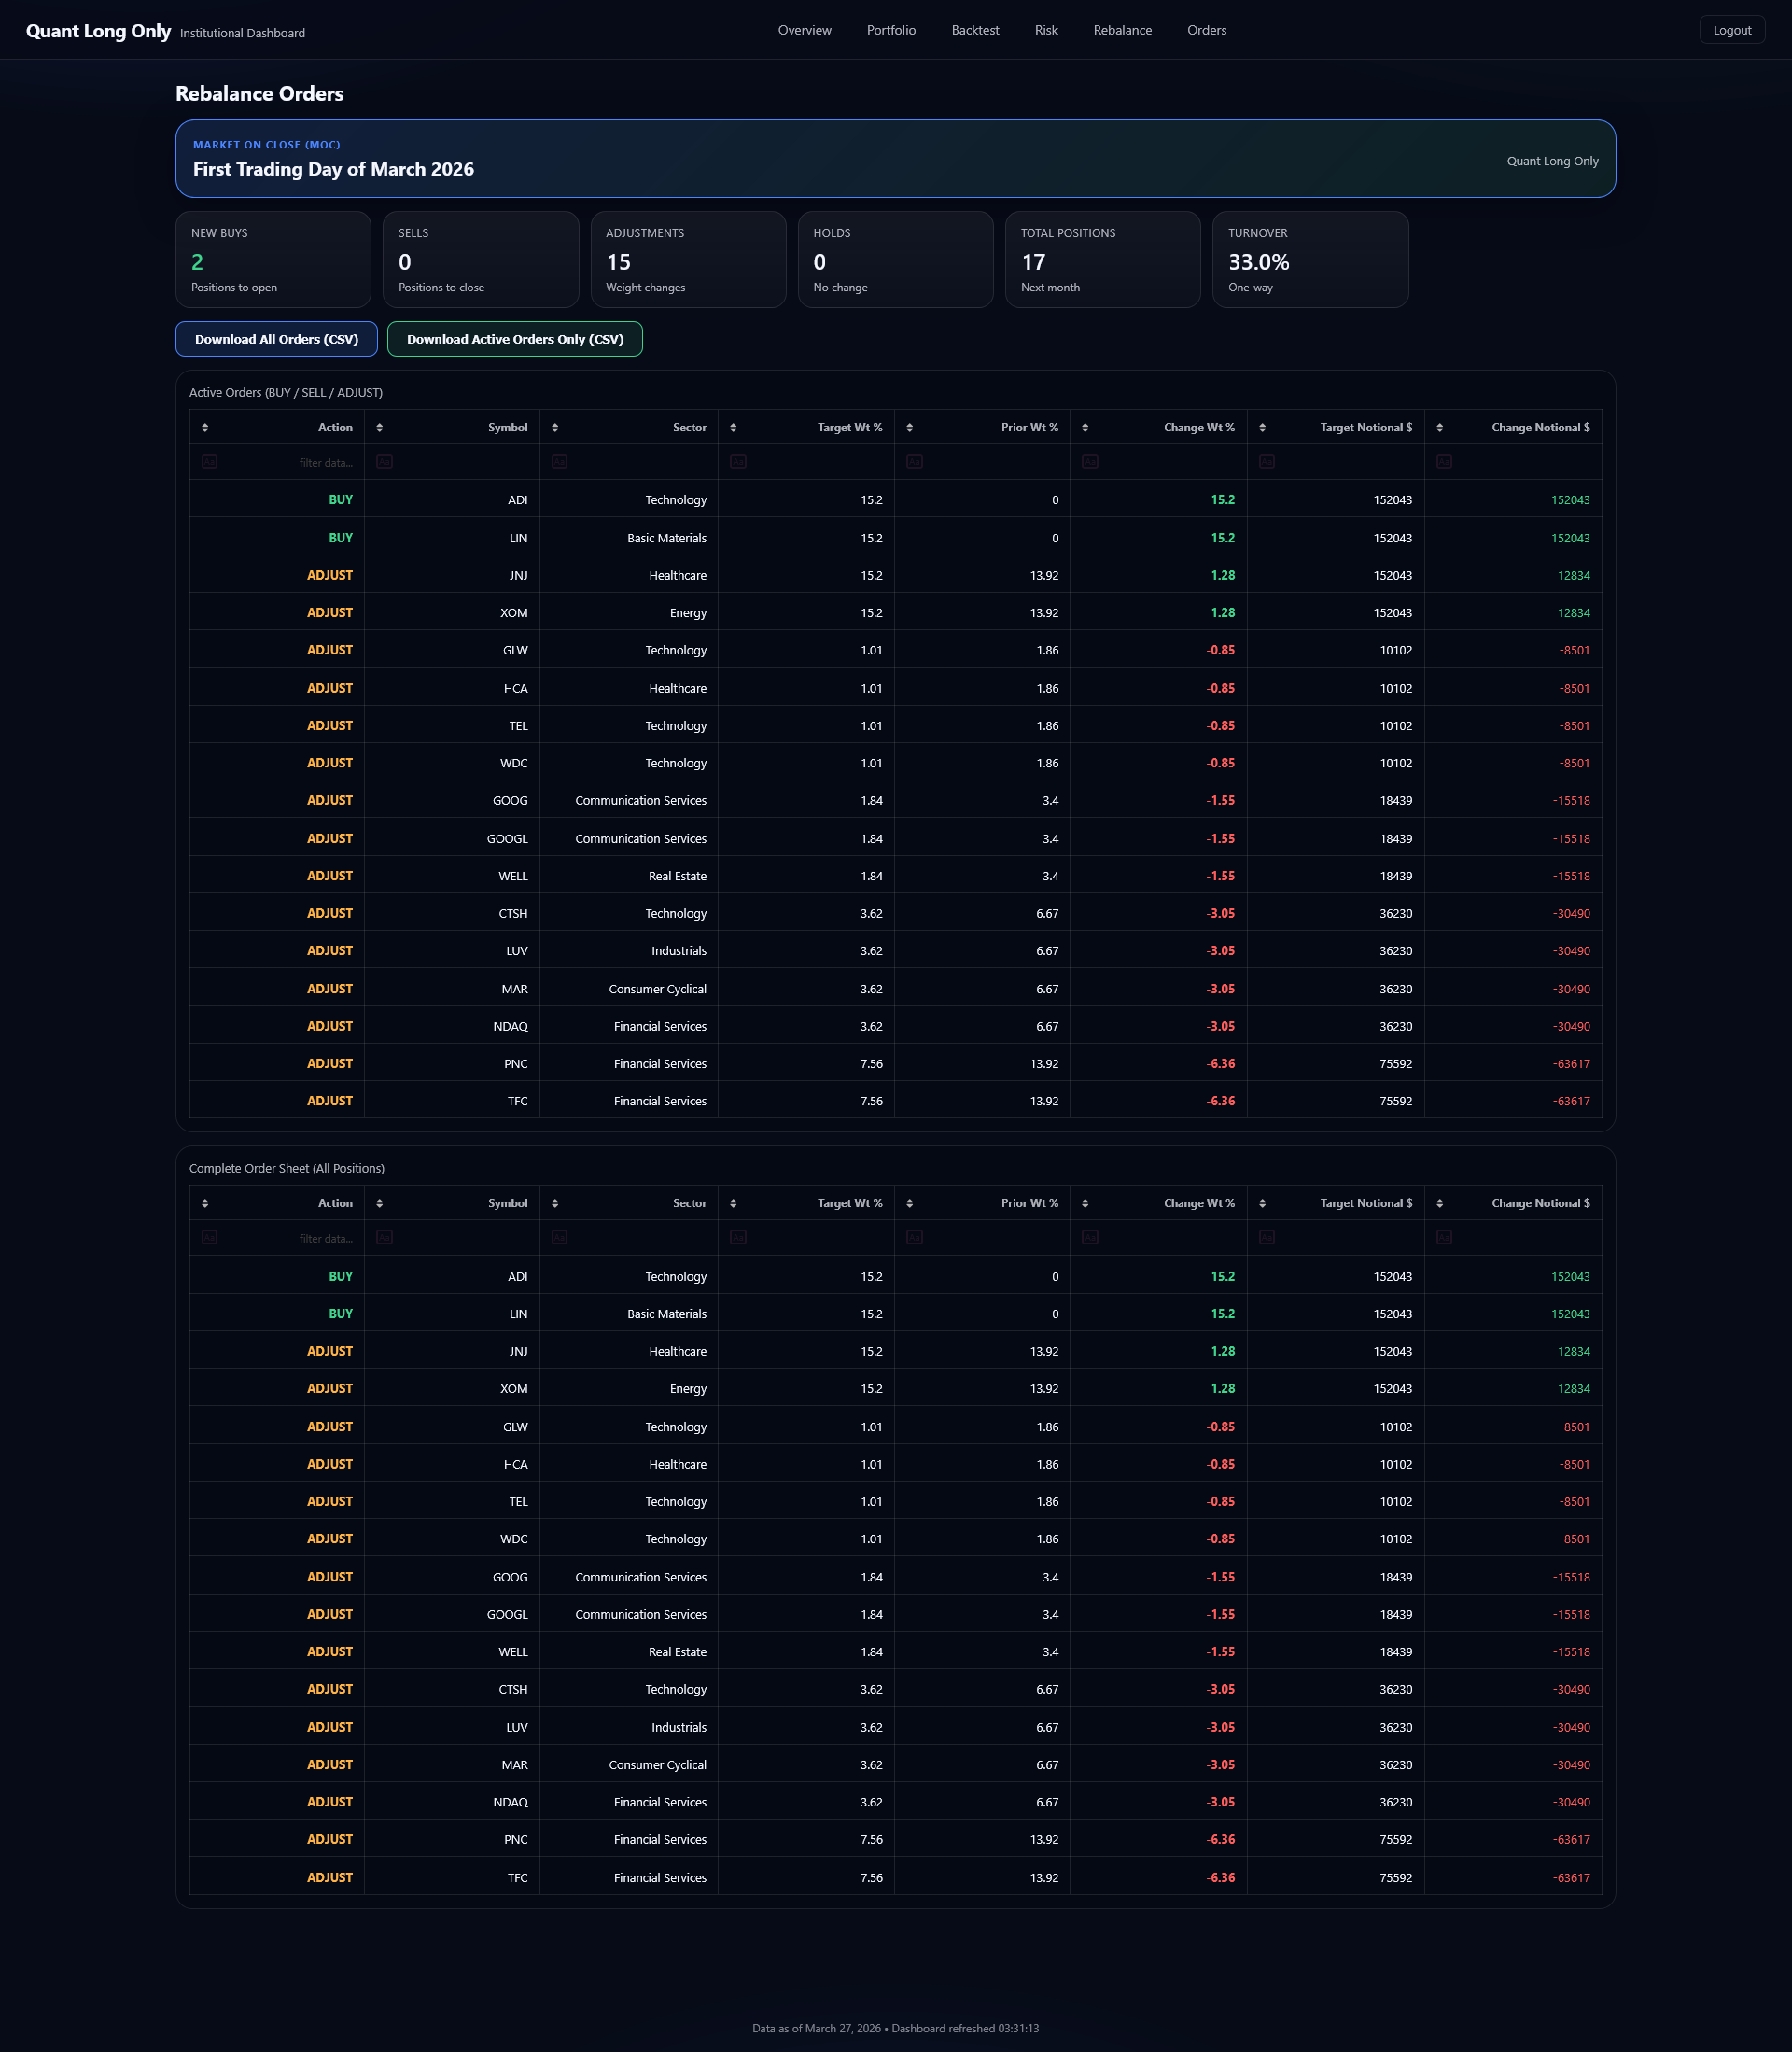
Orders
Market-on-close rebalance orders with new buys, sells, adjustments, holds, total positions, and one-way turnover. Active orders table with action (BUY/SELL/ADJUST), symbol, sector, target weight, prior weight, weight change, and notional. Downloadable as CSV for direct execution.