Risk-Managed Equity Framework
The same systematic equity selection process as Quant Long-Only, overlaid with a beta-adjusted index futures hedge that structurally reduces market exposure. Designed for participants who want to capture stock-specific alpha while neutralizing broad market risk.
How Quant Hedged Works
Quant Hedged starts with the same long equity selection engine as Quant Long-Only — the same multi-factor scoring, the same portfolio construction discipline, the same rebalancing process. What makes it different is the hedge overlay: a systematic short position in index futures, sized using the portfolio's rolling beta, that removes a controlled portion of broad market exposure from the portfolio's return profile.
Long Book: Systematic Equity Selection
The long side of the portfolio follows the same process described in the Quant Long-Only model. Securities are screened from a broad universe, scored across momentum, quality, value, and risk-adjusted signal families, and assembled into a concentrated portfolio with defined position and sector limits. The long book captures the model's view on which individual equities offer the strongest quantitative profile.
The Hedge: Beta-adjusted Index Futures Overlay
The hedge component is a short position in E-mini S&P 500 (ES) futures, sized daily based on the portfolio's rolling beta to the index. The objective is not to eliminate all market risk — it is to systematically reduce the portfolio's sensitivity to broad index moves so that more of the return comes from stock selection (alpha) rather than market direction (beta).
The hedge ratio is computed using an exponentially weighted rolling window of portfolio returns versus index returns. This means the hedge adapts as the portfolio's market sensitivity changes over time — when the portfolio holds higher-beta names, the hedge is larger; when it holds lower-beta names, the hedge is smaller. The result is a portfolio that structurally captures the difference between its long holdings and the broad market.
Regime Awareness & Dynamic Adjustment
The hedge overlay incorporates regime awareness from the same framework used across the model suite. During periods of elevated correlation (where stock-specific returns converge toward market returns), the hedge may be increased. During periods of high dispersion (where stock selection matters more), the hedge maintains its standard sizing. This is a structural adjustment, not a market timing bet — it reflects the statistical reality that hedging is more valuable when correlations are high.
What the Hedge Changes
Relative to the unhedged Quant Long-Only portfolio, the hedged version exhibits lower volatility, shallower drawdowns, and a return profile that is less dependent on market direction. The tradeoff is that in strong bull markets, the hedged portfolio will typically underperform the unhedged version because the short futures position offsets some of the upside. The hedged version is designed for participants who prioritize capital preservation and smoother compounding over maximum upside capture.
Performance Tracking
The dashboard tracks the hedged portfolio NAV separately from the unhedged version, allowing subscribers to see exactly how the hedge affects returns in every market environment. All the same analytics are available — drawdown analysis, rolling risk metrics, factor attribution — computed on the hedged return stream. A comparison view shows hedged versus unhedged versus SPY side by side.
What Subscribers Receive
Subscribers access the same five-tab dashboard as Quant Long-Only, but all metrics reflect the hedged portfolio. The overview shows hedged NAV and returns, the risk tab shows hedged volatility and drawdown, and the portfolio tab shows the long book plus the current hedge position and notional. Subscribers see both the stock-specific contribution and the hedge impact clearly separated.
What You See as a Subscriber
The Quant Hedged dashboard mirrors the Long-Only structure but all performance, risk, and attribution reflects the hedged return stream.
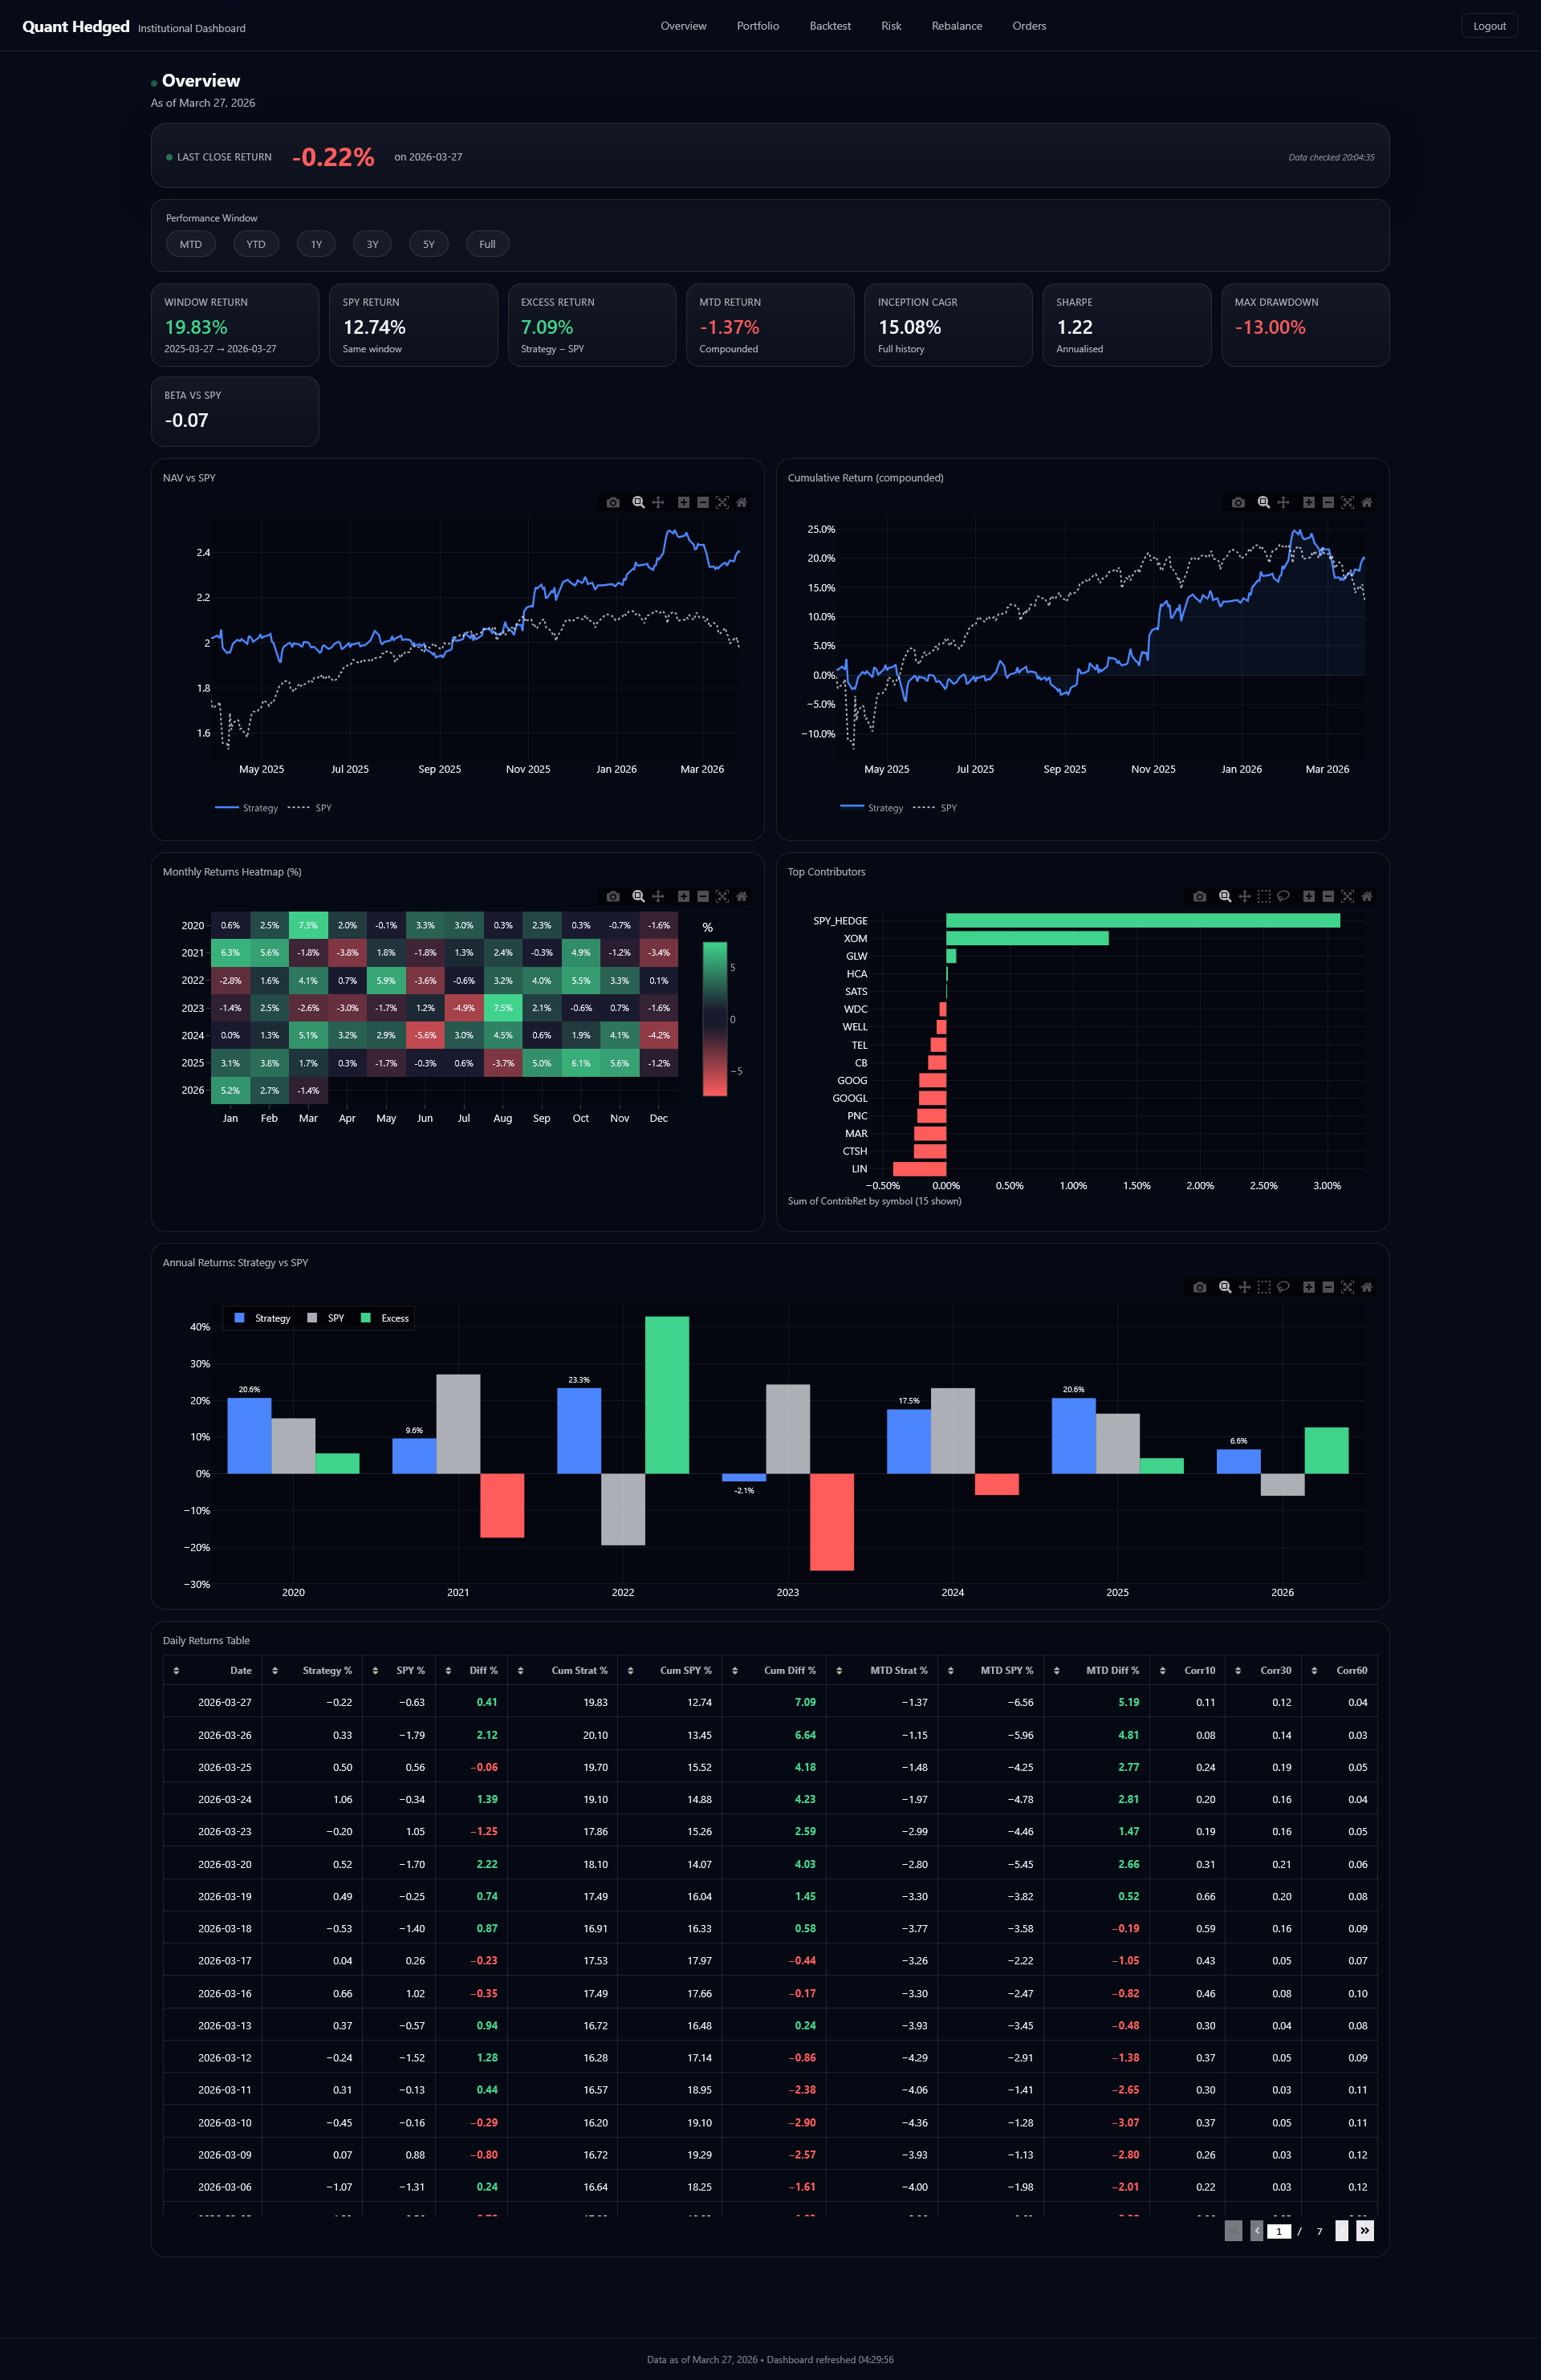
Overview
Last close return, selectable performance windows, KPI row with window return, SPY return, excess, MTD, inception CAGR 15.08%, Sharpe 1.22, max drawdown -13%, and beta -0.07. NAV vs SPY chart, cumulative return, monthly heatmap, top contributors including SPY_HEDGE impact, annual returns, and daily returns table.
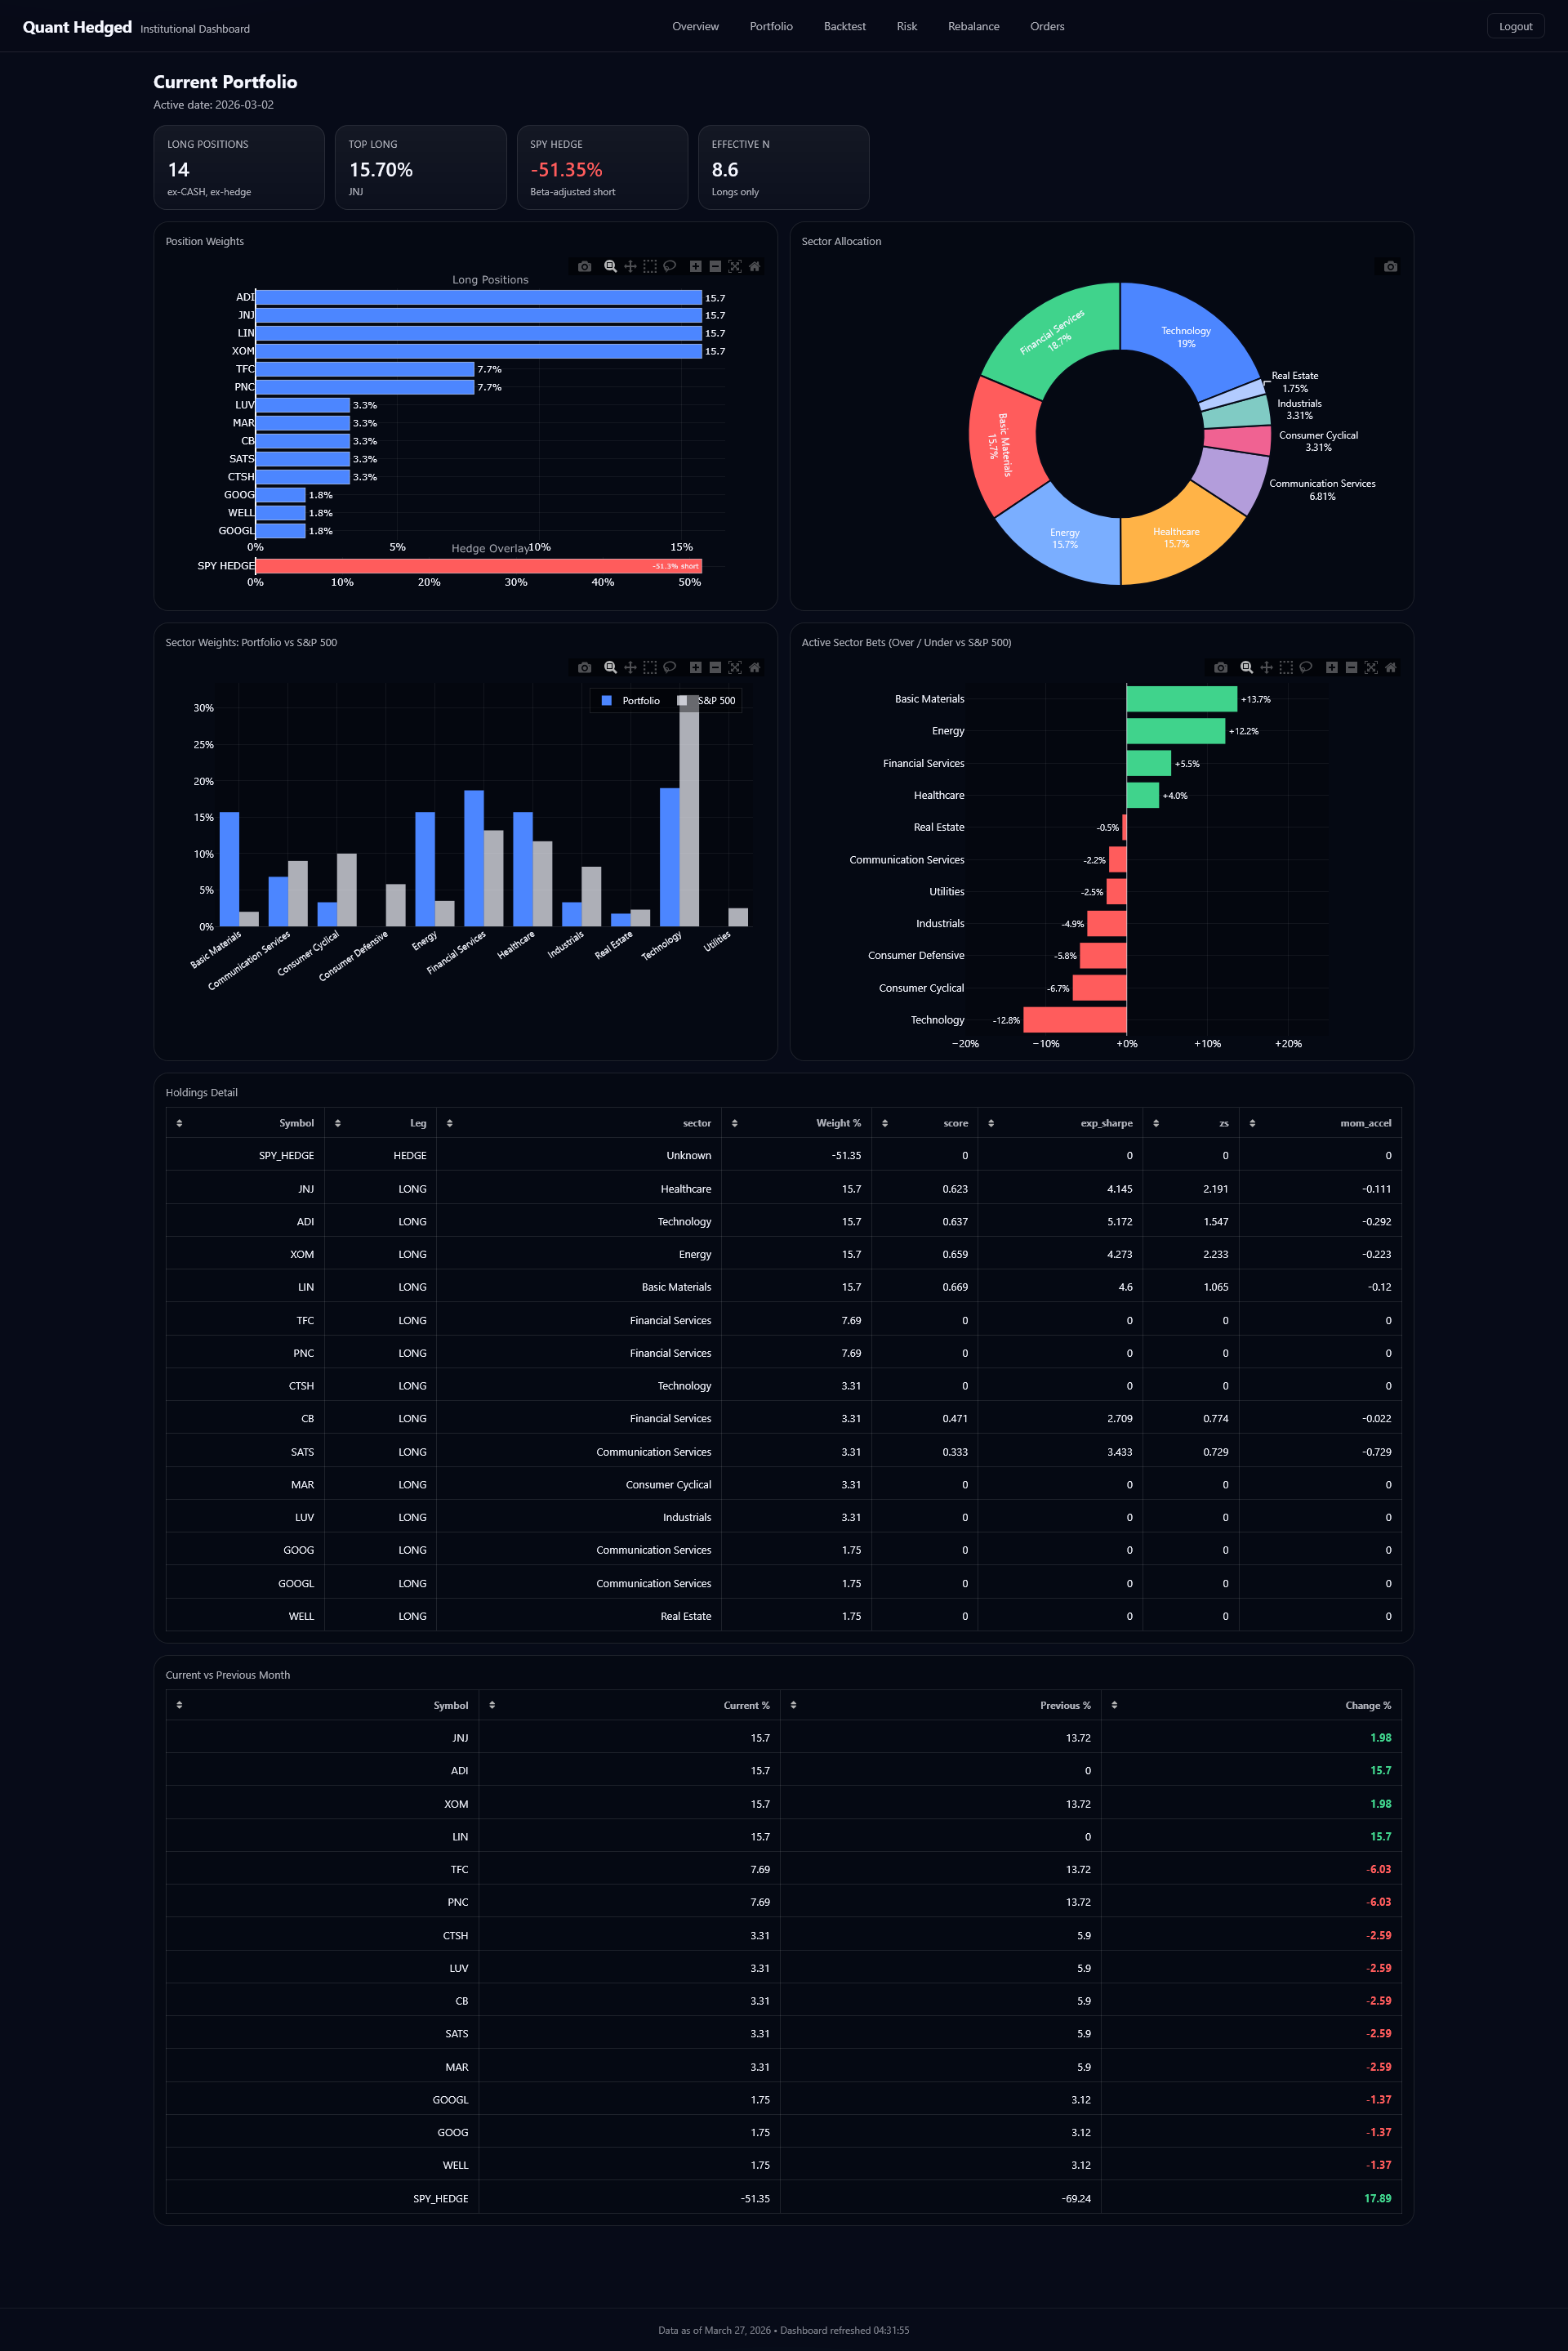
Portfolio
14 long positions plus SPY_HEDGE short at -51.35% (beta-adjusted). Top long weight, effective N, position weights with hedge overlay bar, sector allocation donut, sector bets vs S&P 500, holdings detail with leg designation (LONG/HEDGE), score, expected Sharpe, and current vs previous month weight changes.
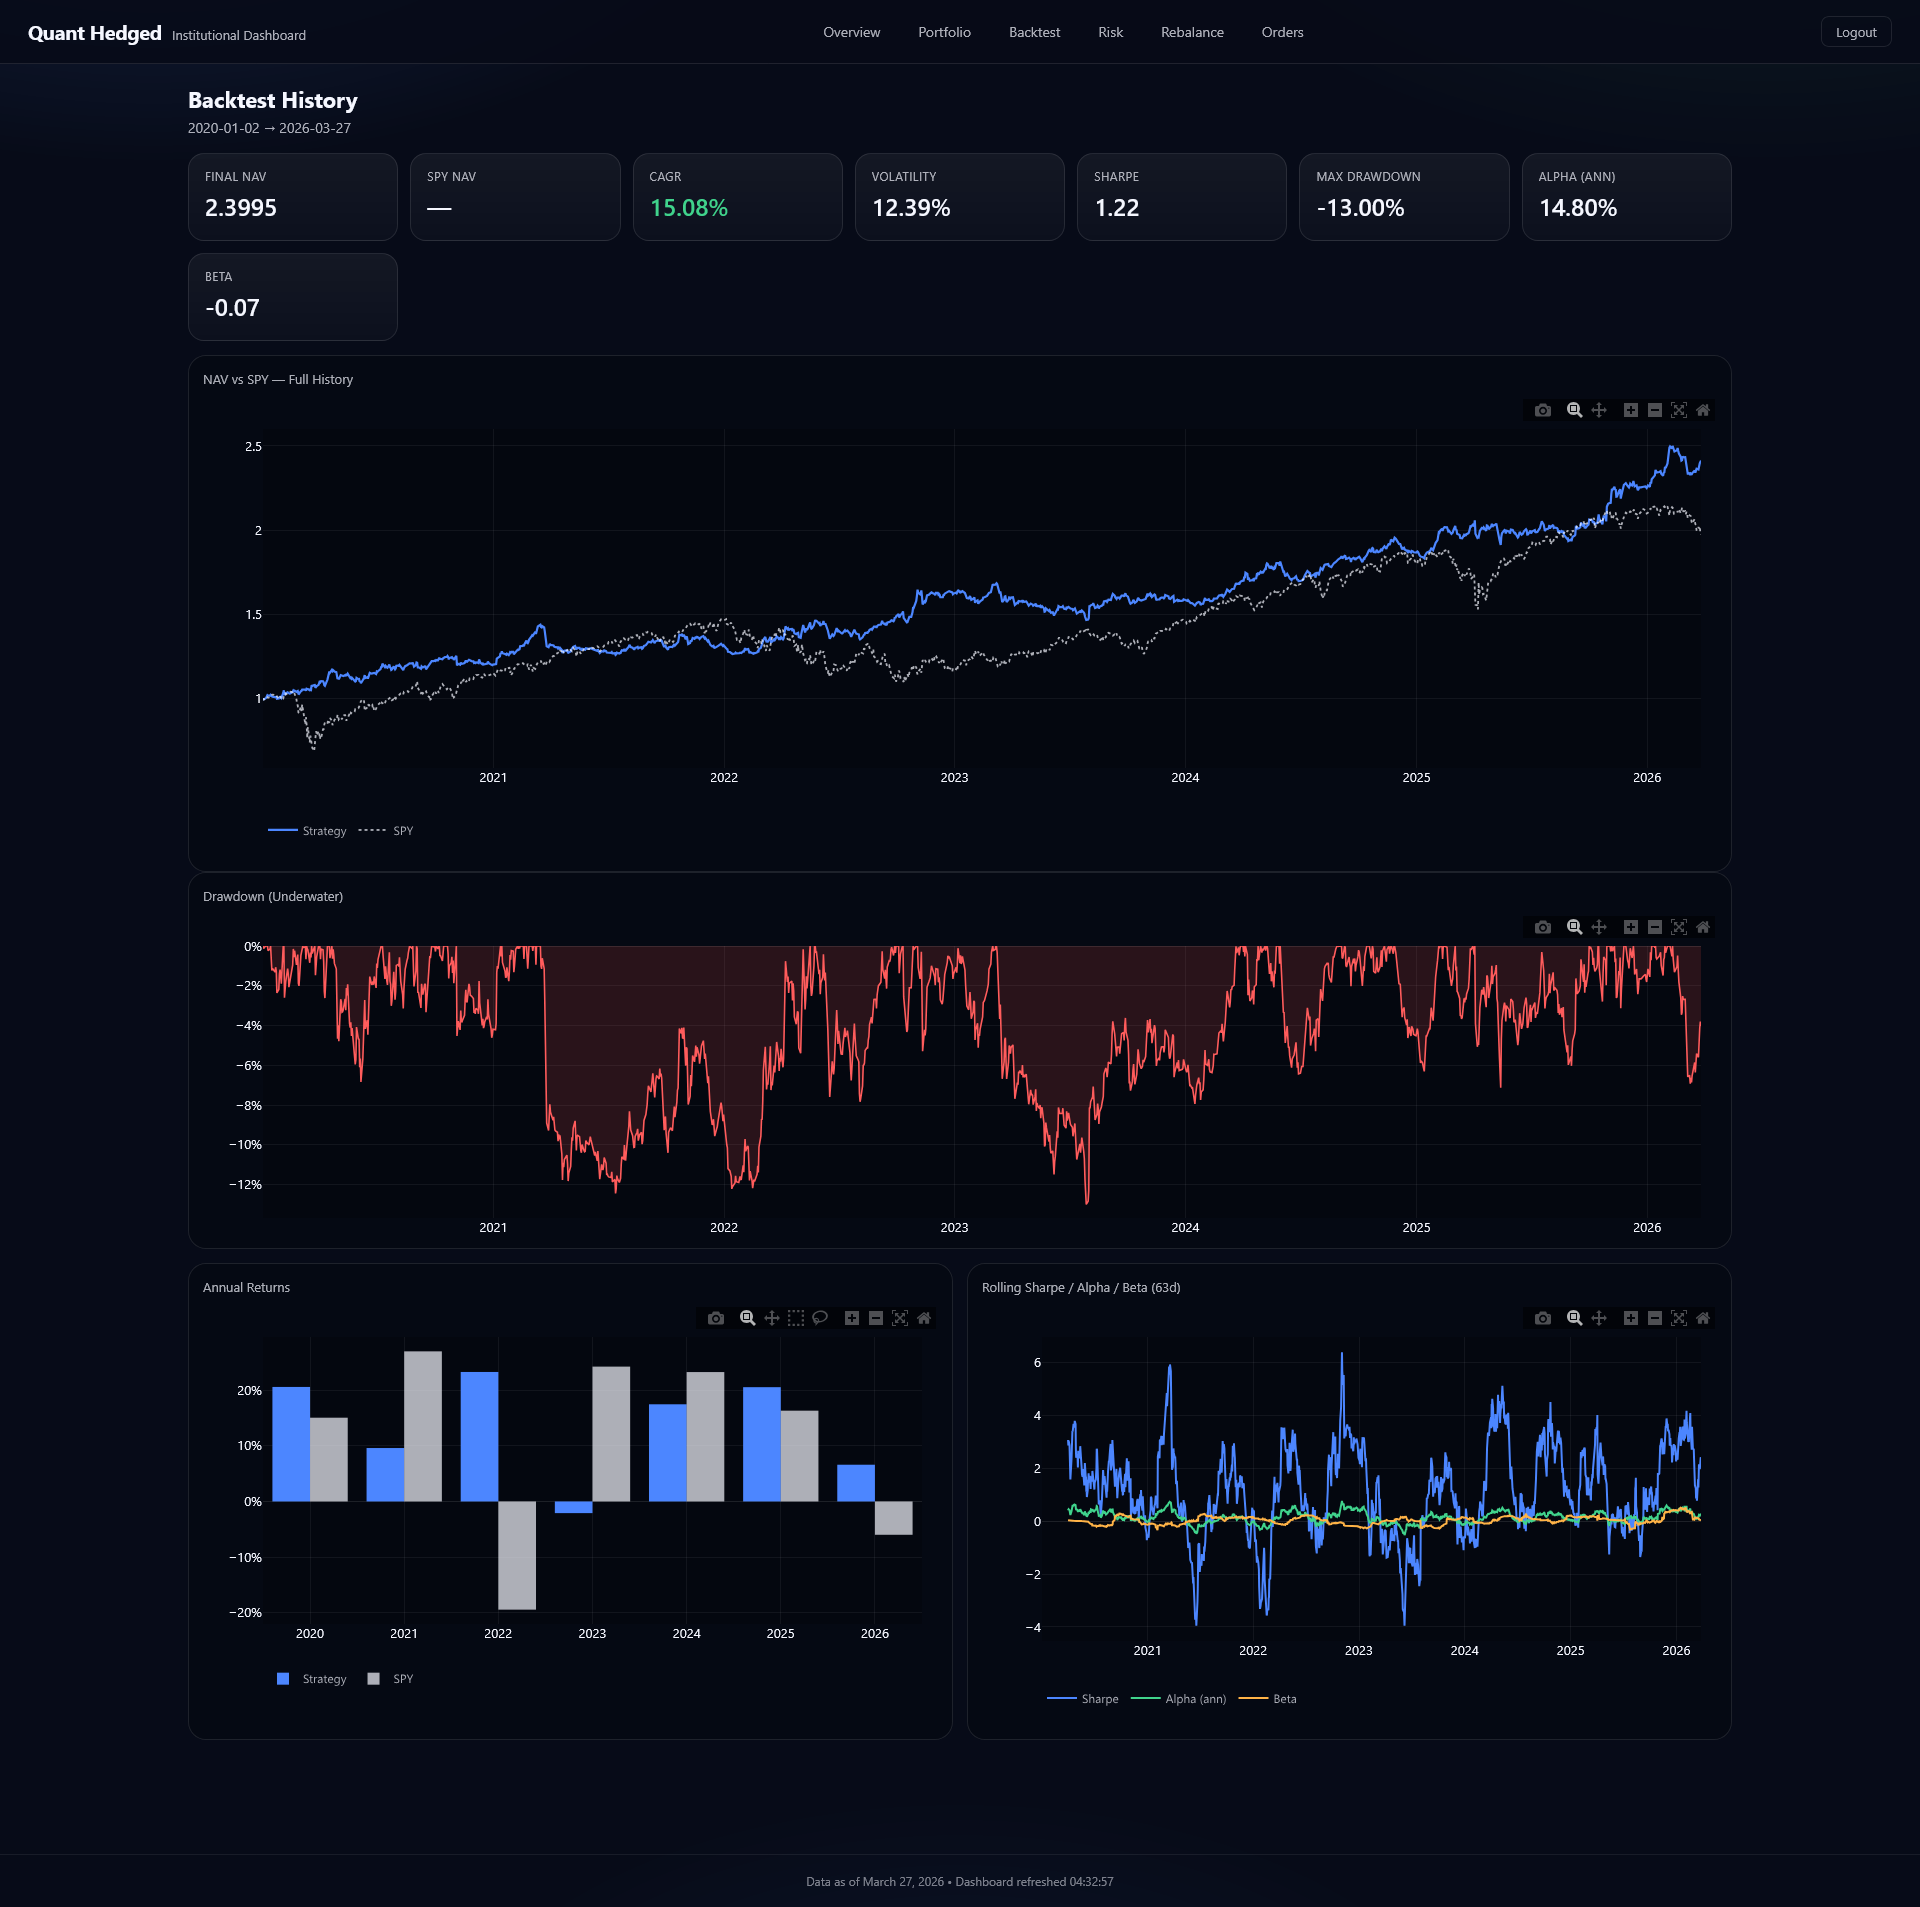
Backtest
Full history from 2020 with final NAV 2.40, CAGR 15.08%, volatility 12.39%, Sharpe 1.22, max drawdown -13%, alpha 14.80%, beta -0.07. NAV vs SPY equity curve showing reduced drawdowns, underwater chart, annual returns, and rolling Sharpe / alpha / beta over 63-day windows.
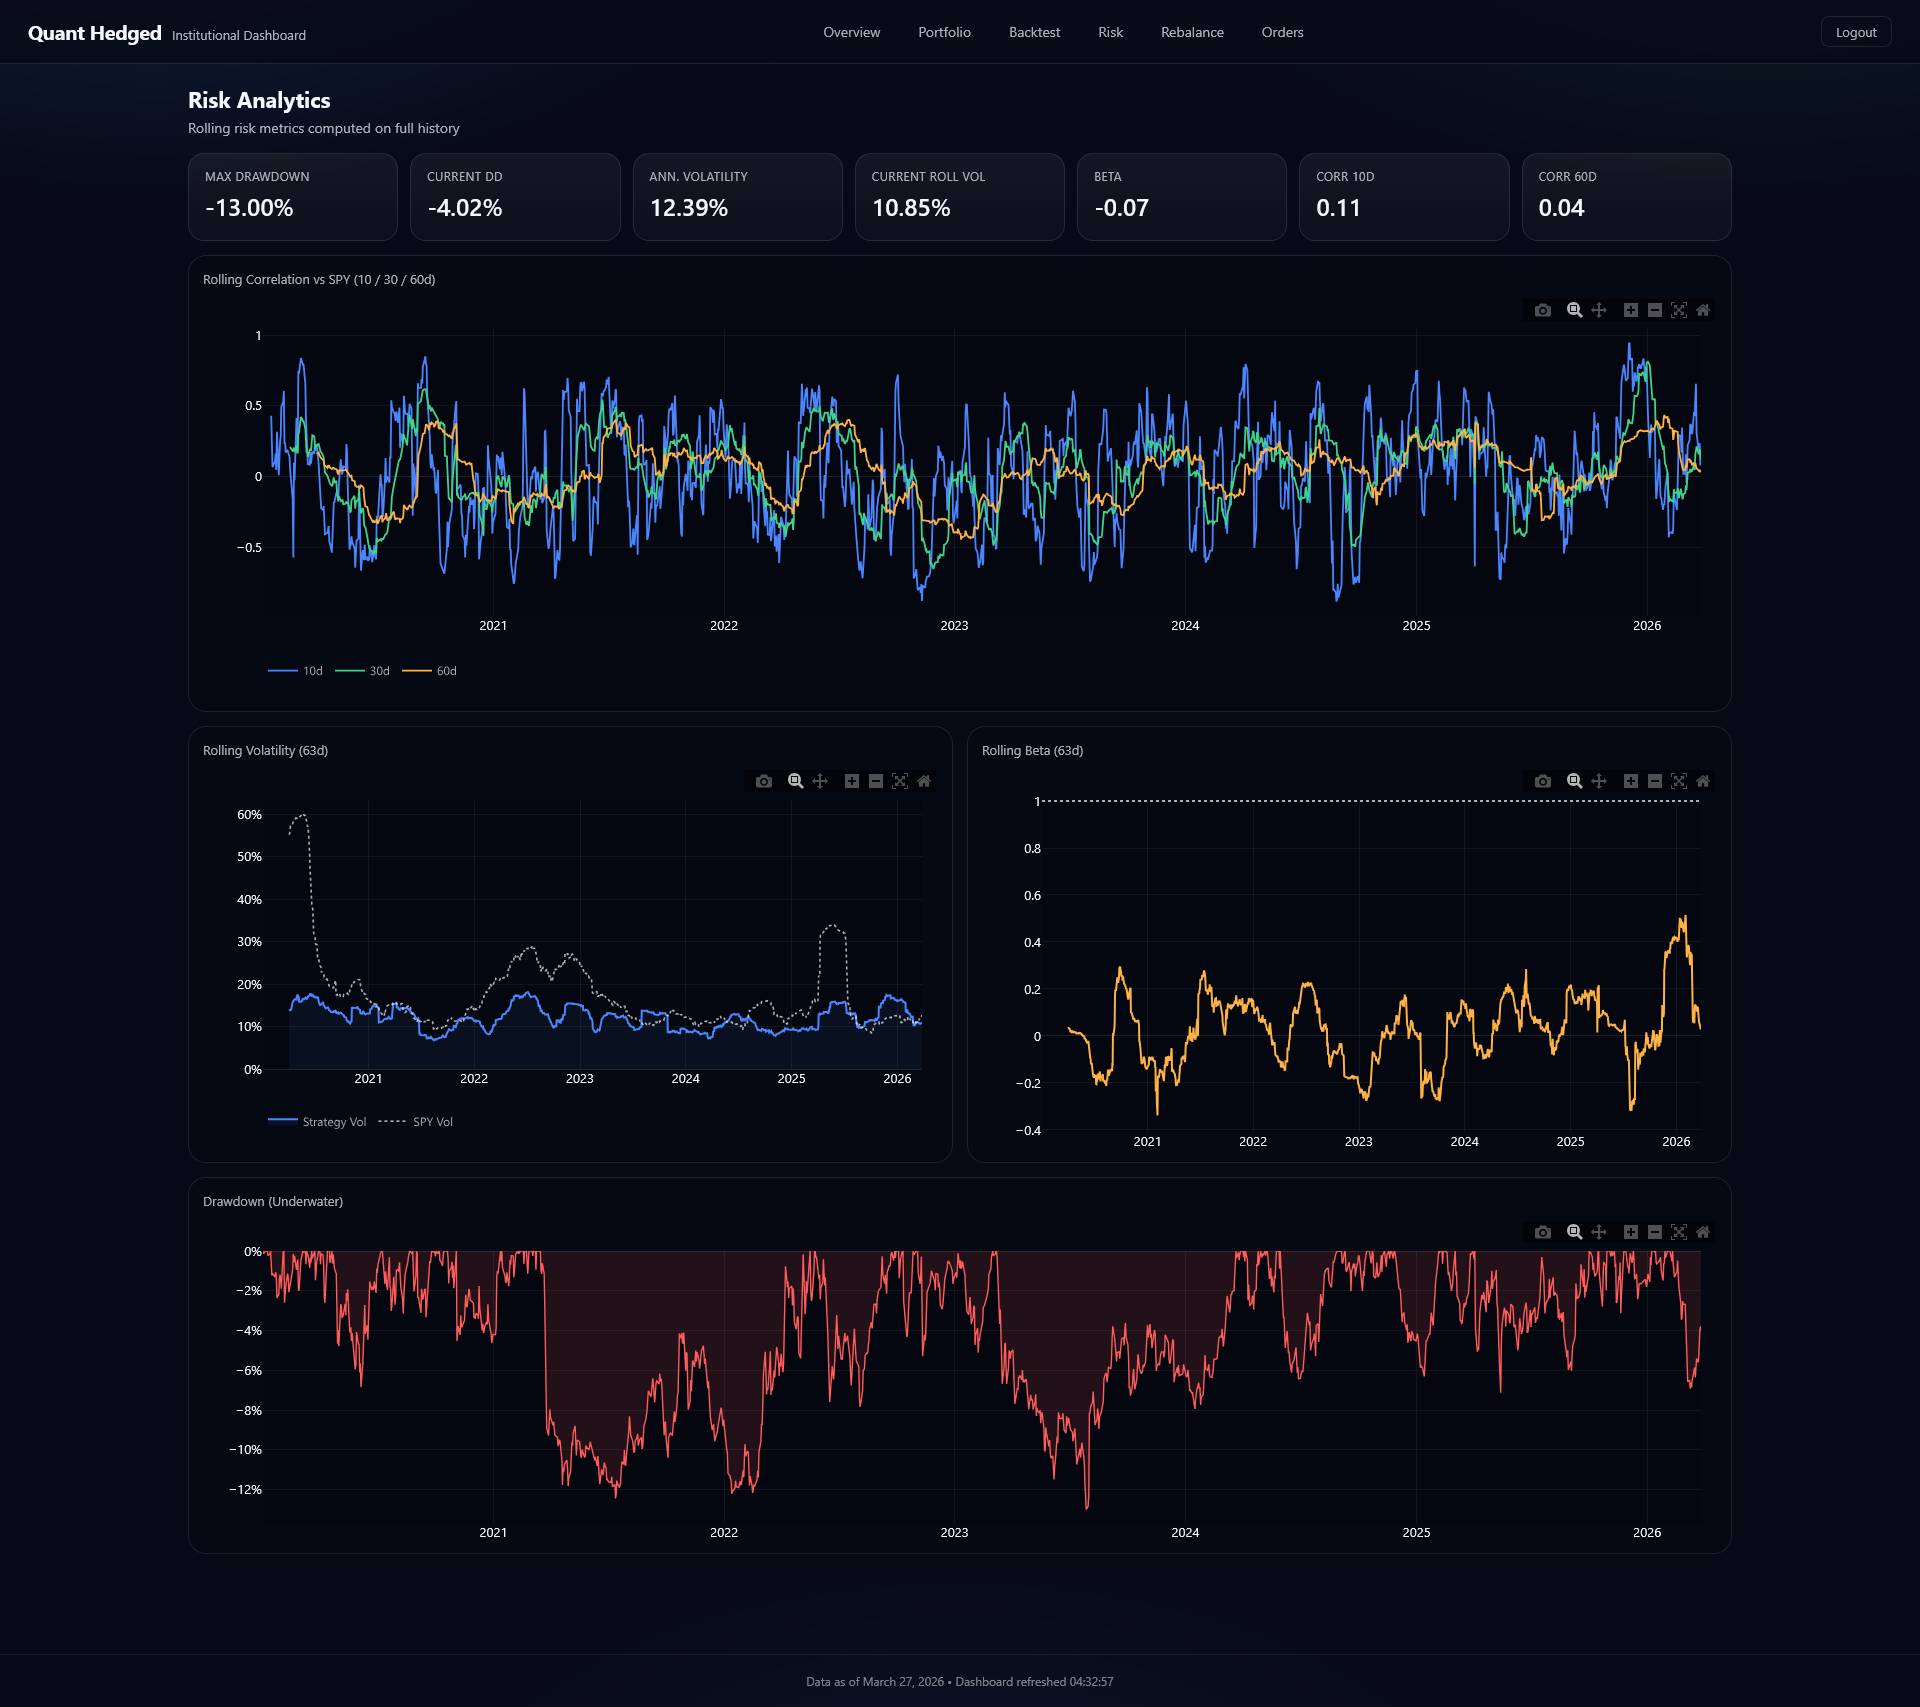
Risk
Max drawdown -13%, current drawdown -4.02%, annualized vol 12.39%, current rolling vol 10.85%, beta -0.07, correlations 0.11 (10d) and 0.04 (60d). Rolling correlation across three windows, rolling volatility (strategy well below SPY), rolling beta near zero confirming hedge effectiveness, and drawdown underwater chart.
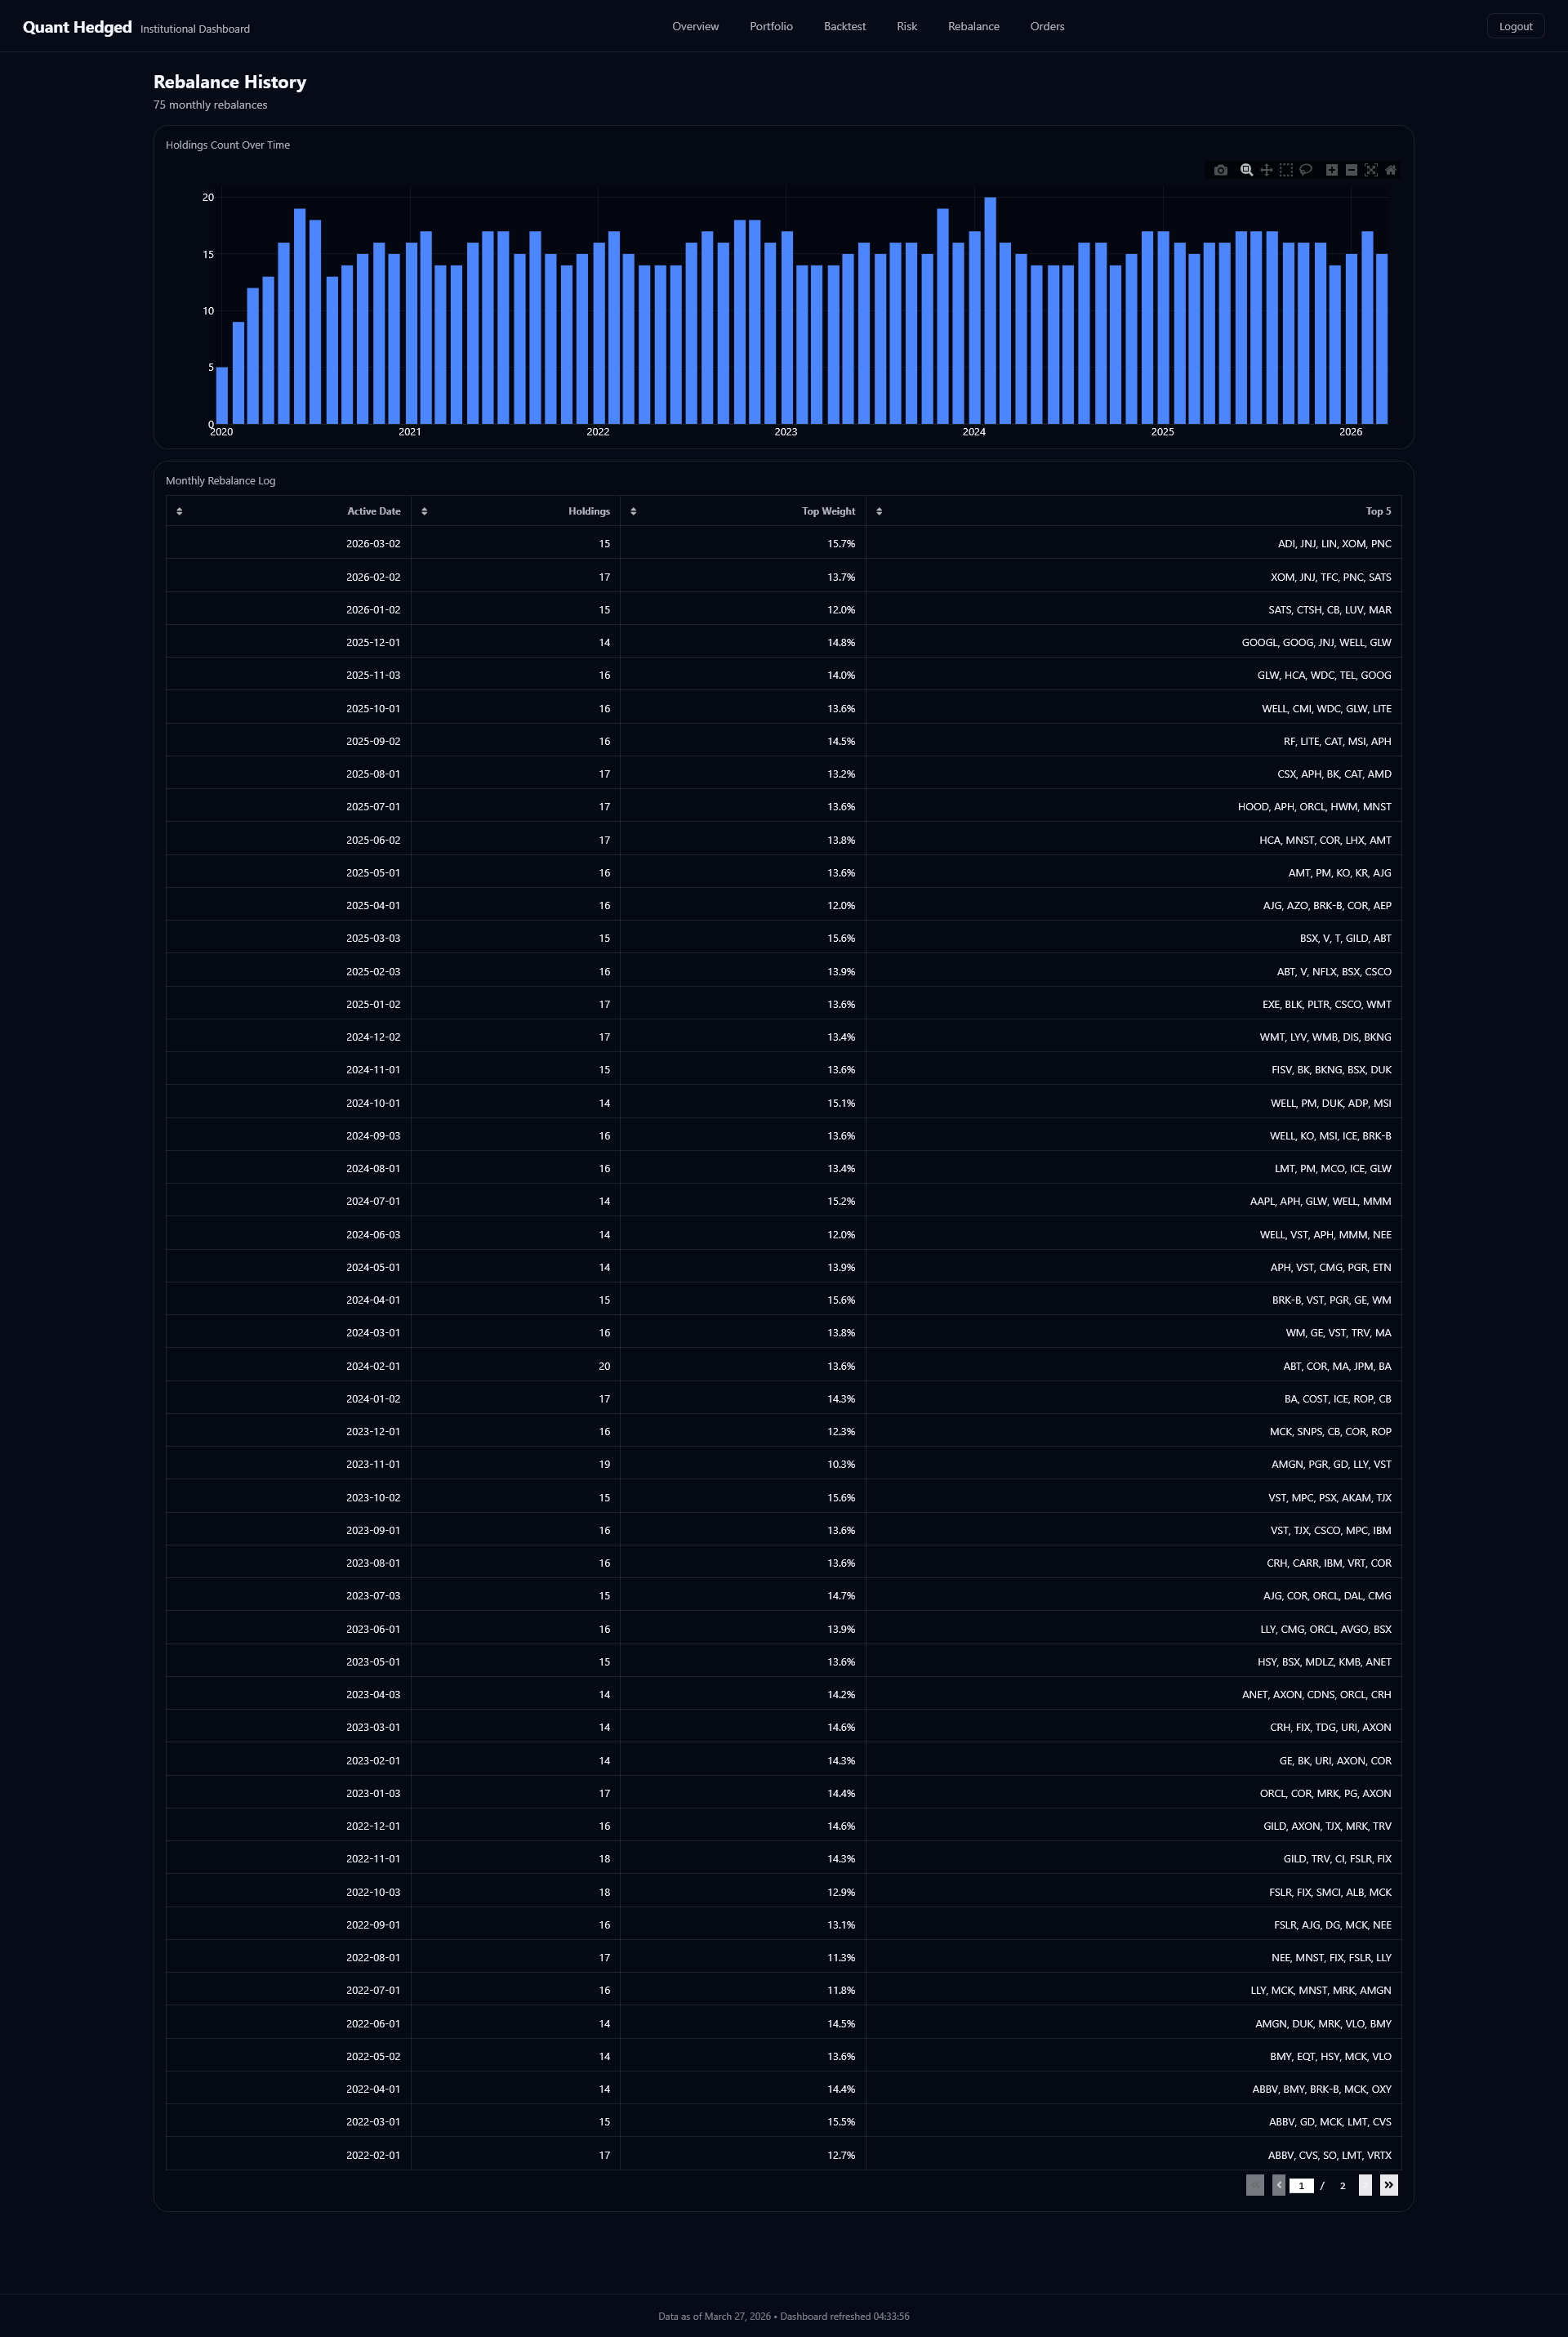
Rebalance
Complete rebalance history with 71+ monthly rebalances. Holdings count over time, and full monthly log showing active date, number of holdings (including hedge), top weight, and top 5 names for every period back to inception.
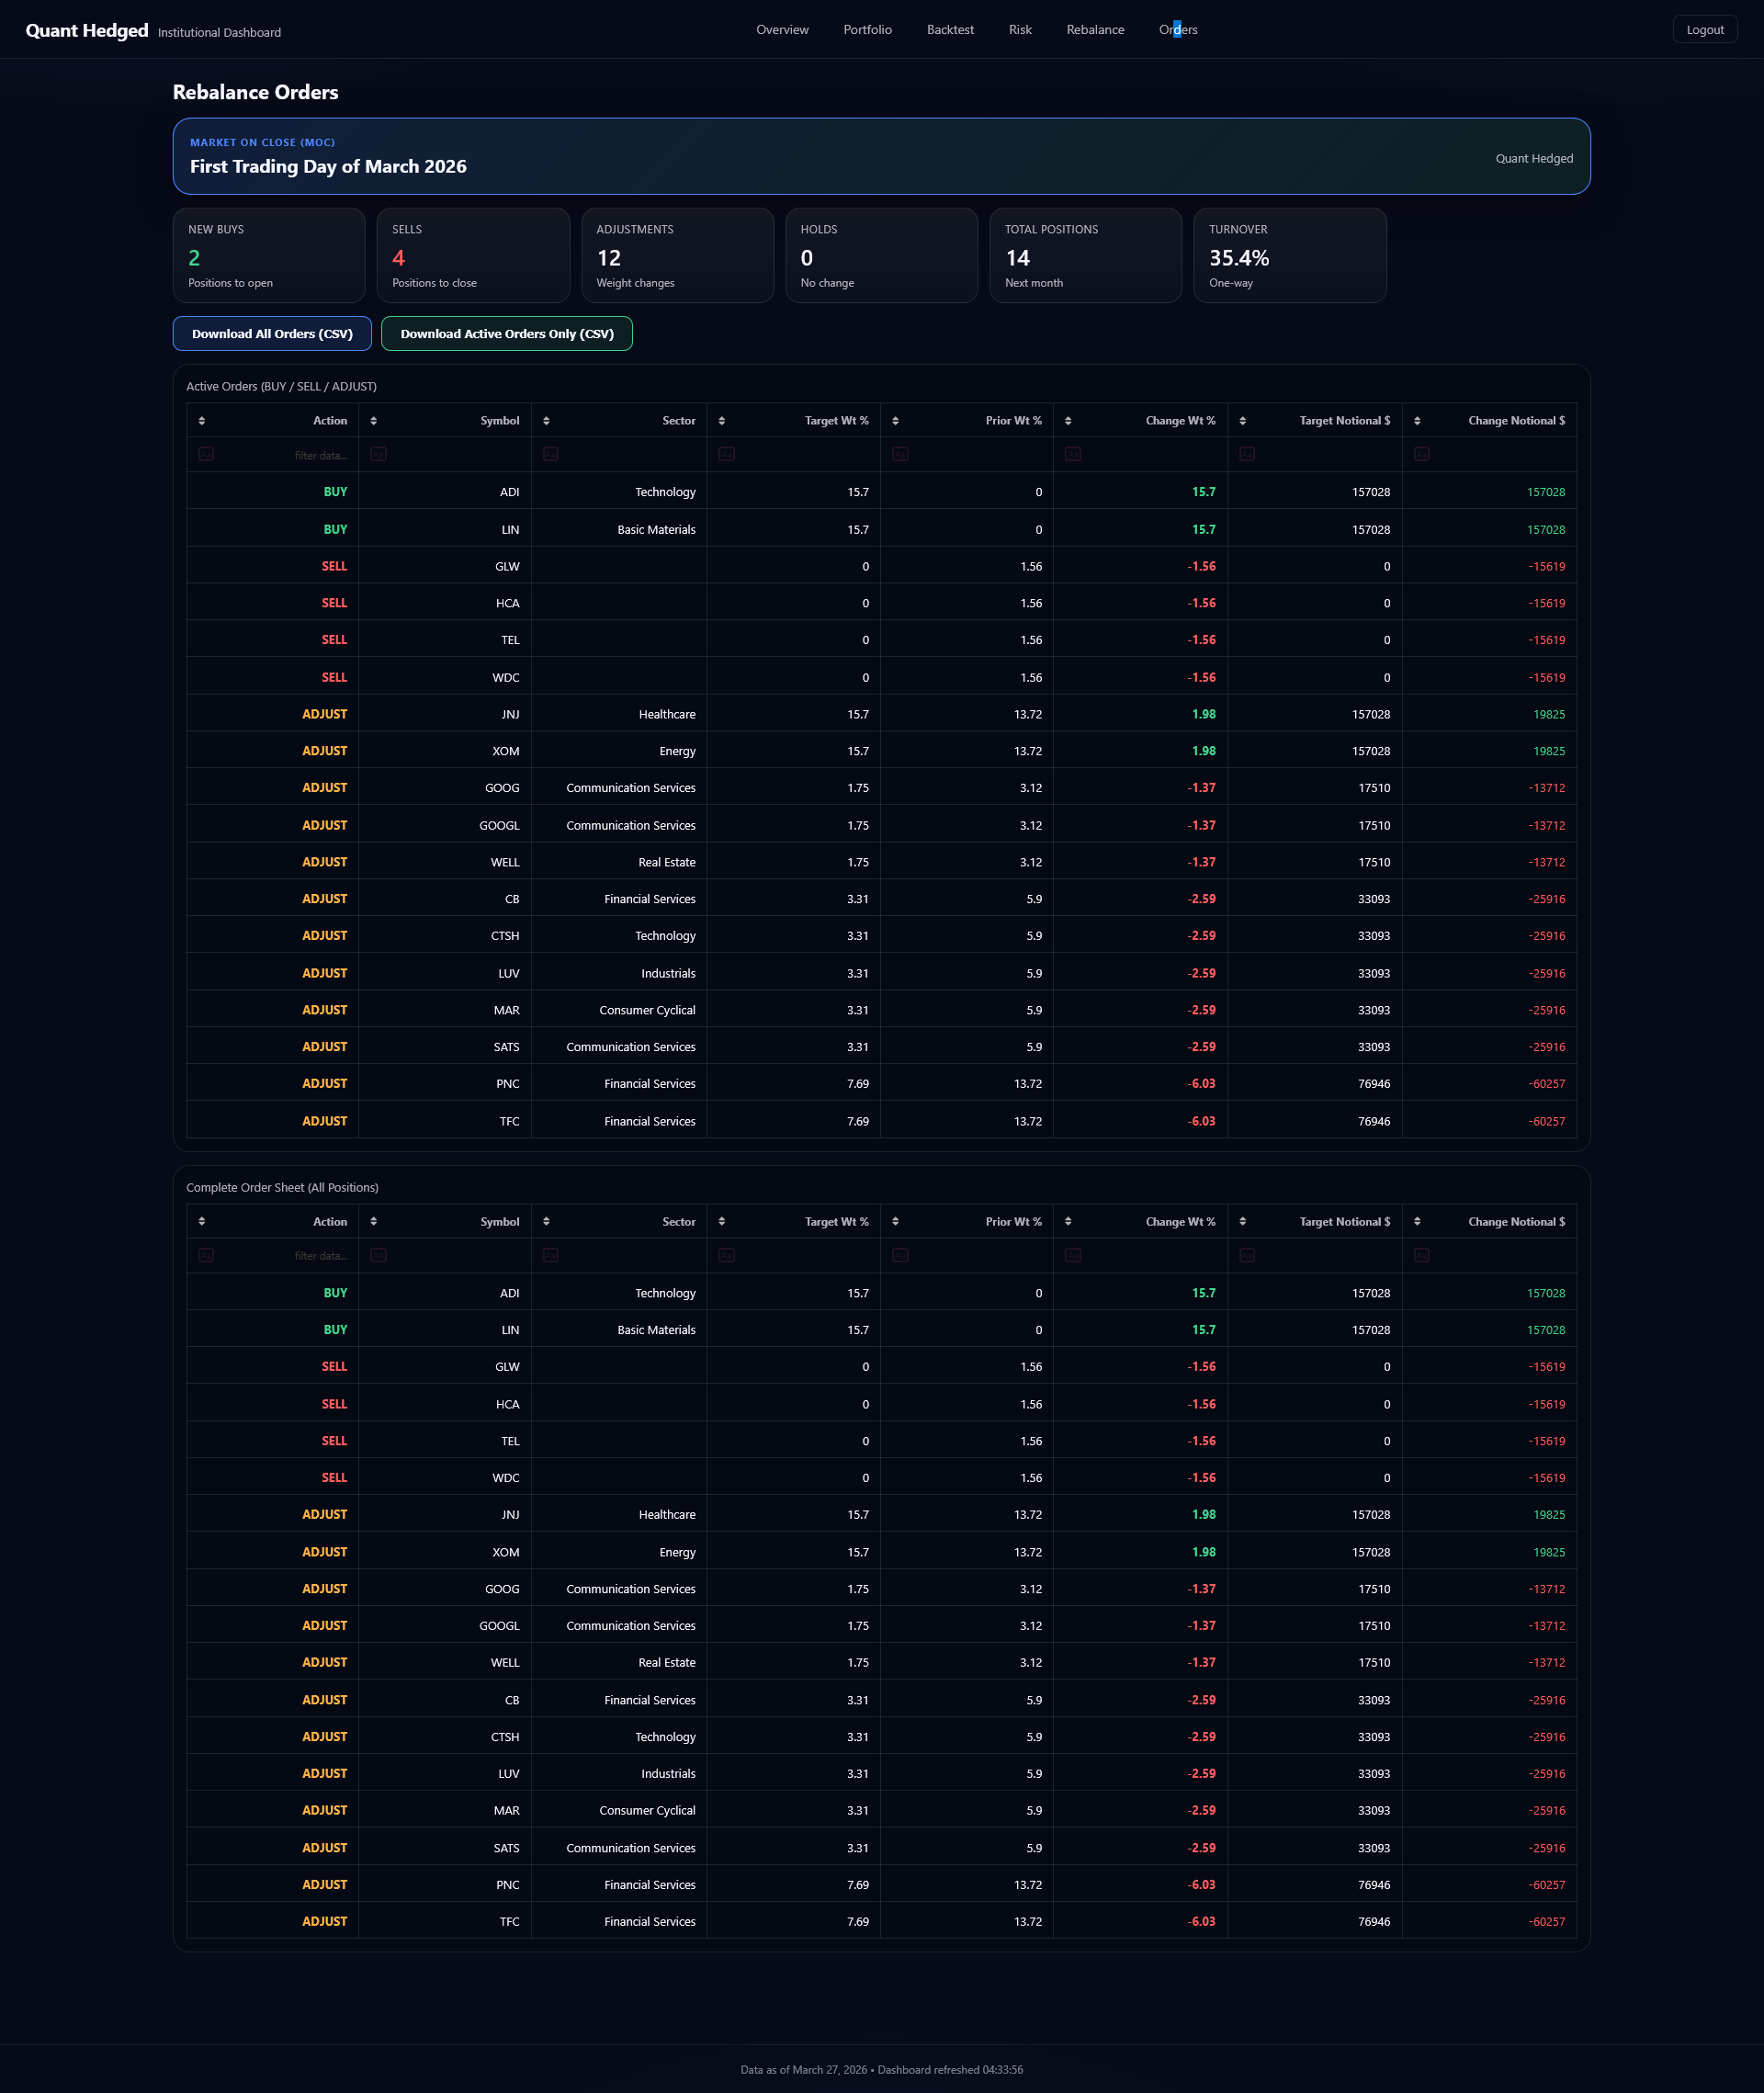
Orders
Market-on-close rebalance orders with buys, sells (including hedge exits), adjustments, total positions, and 35.4% one-way turnover. Active orders showing BUY/SELL/ADJUST actions with symbol, sector, target weight, prior weight, change, and notional. Downloadable as CSV.