Quantitative Portfolio Margin Model
A fully managed quantitative portfolio that generates daily market-on-open orders across a systematically constructed book. Designed for participants with portfolio margin accounts who want institutional-grade process without discretionary intervention.
How QPM Works
QPM operates as a fully systematic portfolio construction engine. Every trading day, the model evaluates the investable universe against a multi-dimensional scoring framework, constructs an optimal portfolio, and generates market-on-open orders for the next session. There is no discretionary overlay — the process runs the same way every day regardless of market narrative.
Universe Screening & Signal Generation
The model begins by screening a broad equity universe through a series of quantitative filters. Candidates are evaluated across momentum characteristics, fundamental quality metrics, volatility behavior, and cross-sectional ranking signals. The scoring framework is designed to identify securities where multiple independent signals converge, reducing dependence on any single factor.
Portfolio Construction & Position Sizing
Qualifying securities are assembled into a portfolio using a systematic weighting scheme that accounts for expected contribution to return, correlation structure, and individual position risk. Position sizes are calibrated relative to portfolio margin requirements, ensuring the book remains within defined leverage and concentration parameters. The result is a diversified, risk-aware allocation that updates daily.
Regime Awareness & Risk Controls
QPM incorporates regime detection to modulate exposure based on prevailing market conditions. During periods of elevated volatility, correlation compression, or deteriorating breadth, the model reduces gross exposure and tightens position limits. This is not a timing mechanism — it is a structural guardrail that adjusts the aggressiveness of the portfolio based on observable market state.
Daily Execution & Rebalancing
Each session, the model compares the current portfolio to the new target allocation and generates a set of market-on-open orders to close the gap. Subscribers receive the full order set with ticker, direction, and quantity. The process runs daily, maintaining alignment between the model's current view and the live portfolio.
What Subscribers Receive
QPM subscribers access a live dashboard application that displays the current portfolio, historical NAV, performance attribution, risk metrics, and the daily rebalance output. The dashboard updates throughout the day with live P&L and refreshes the full model output each evening after market close.
What You See as a Subscriber
The QPM dashboard is a live application — not a static report. Every tab is interactive and updates with real-time and end-of-day data.
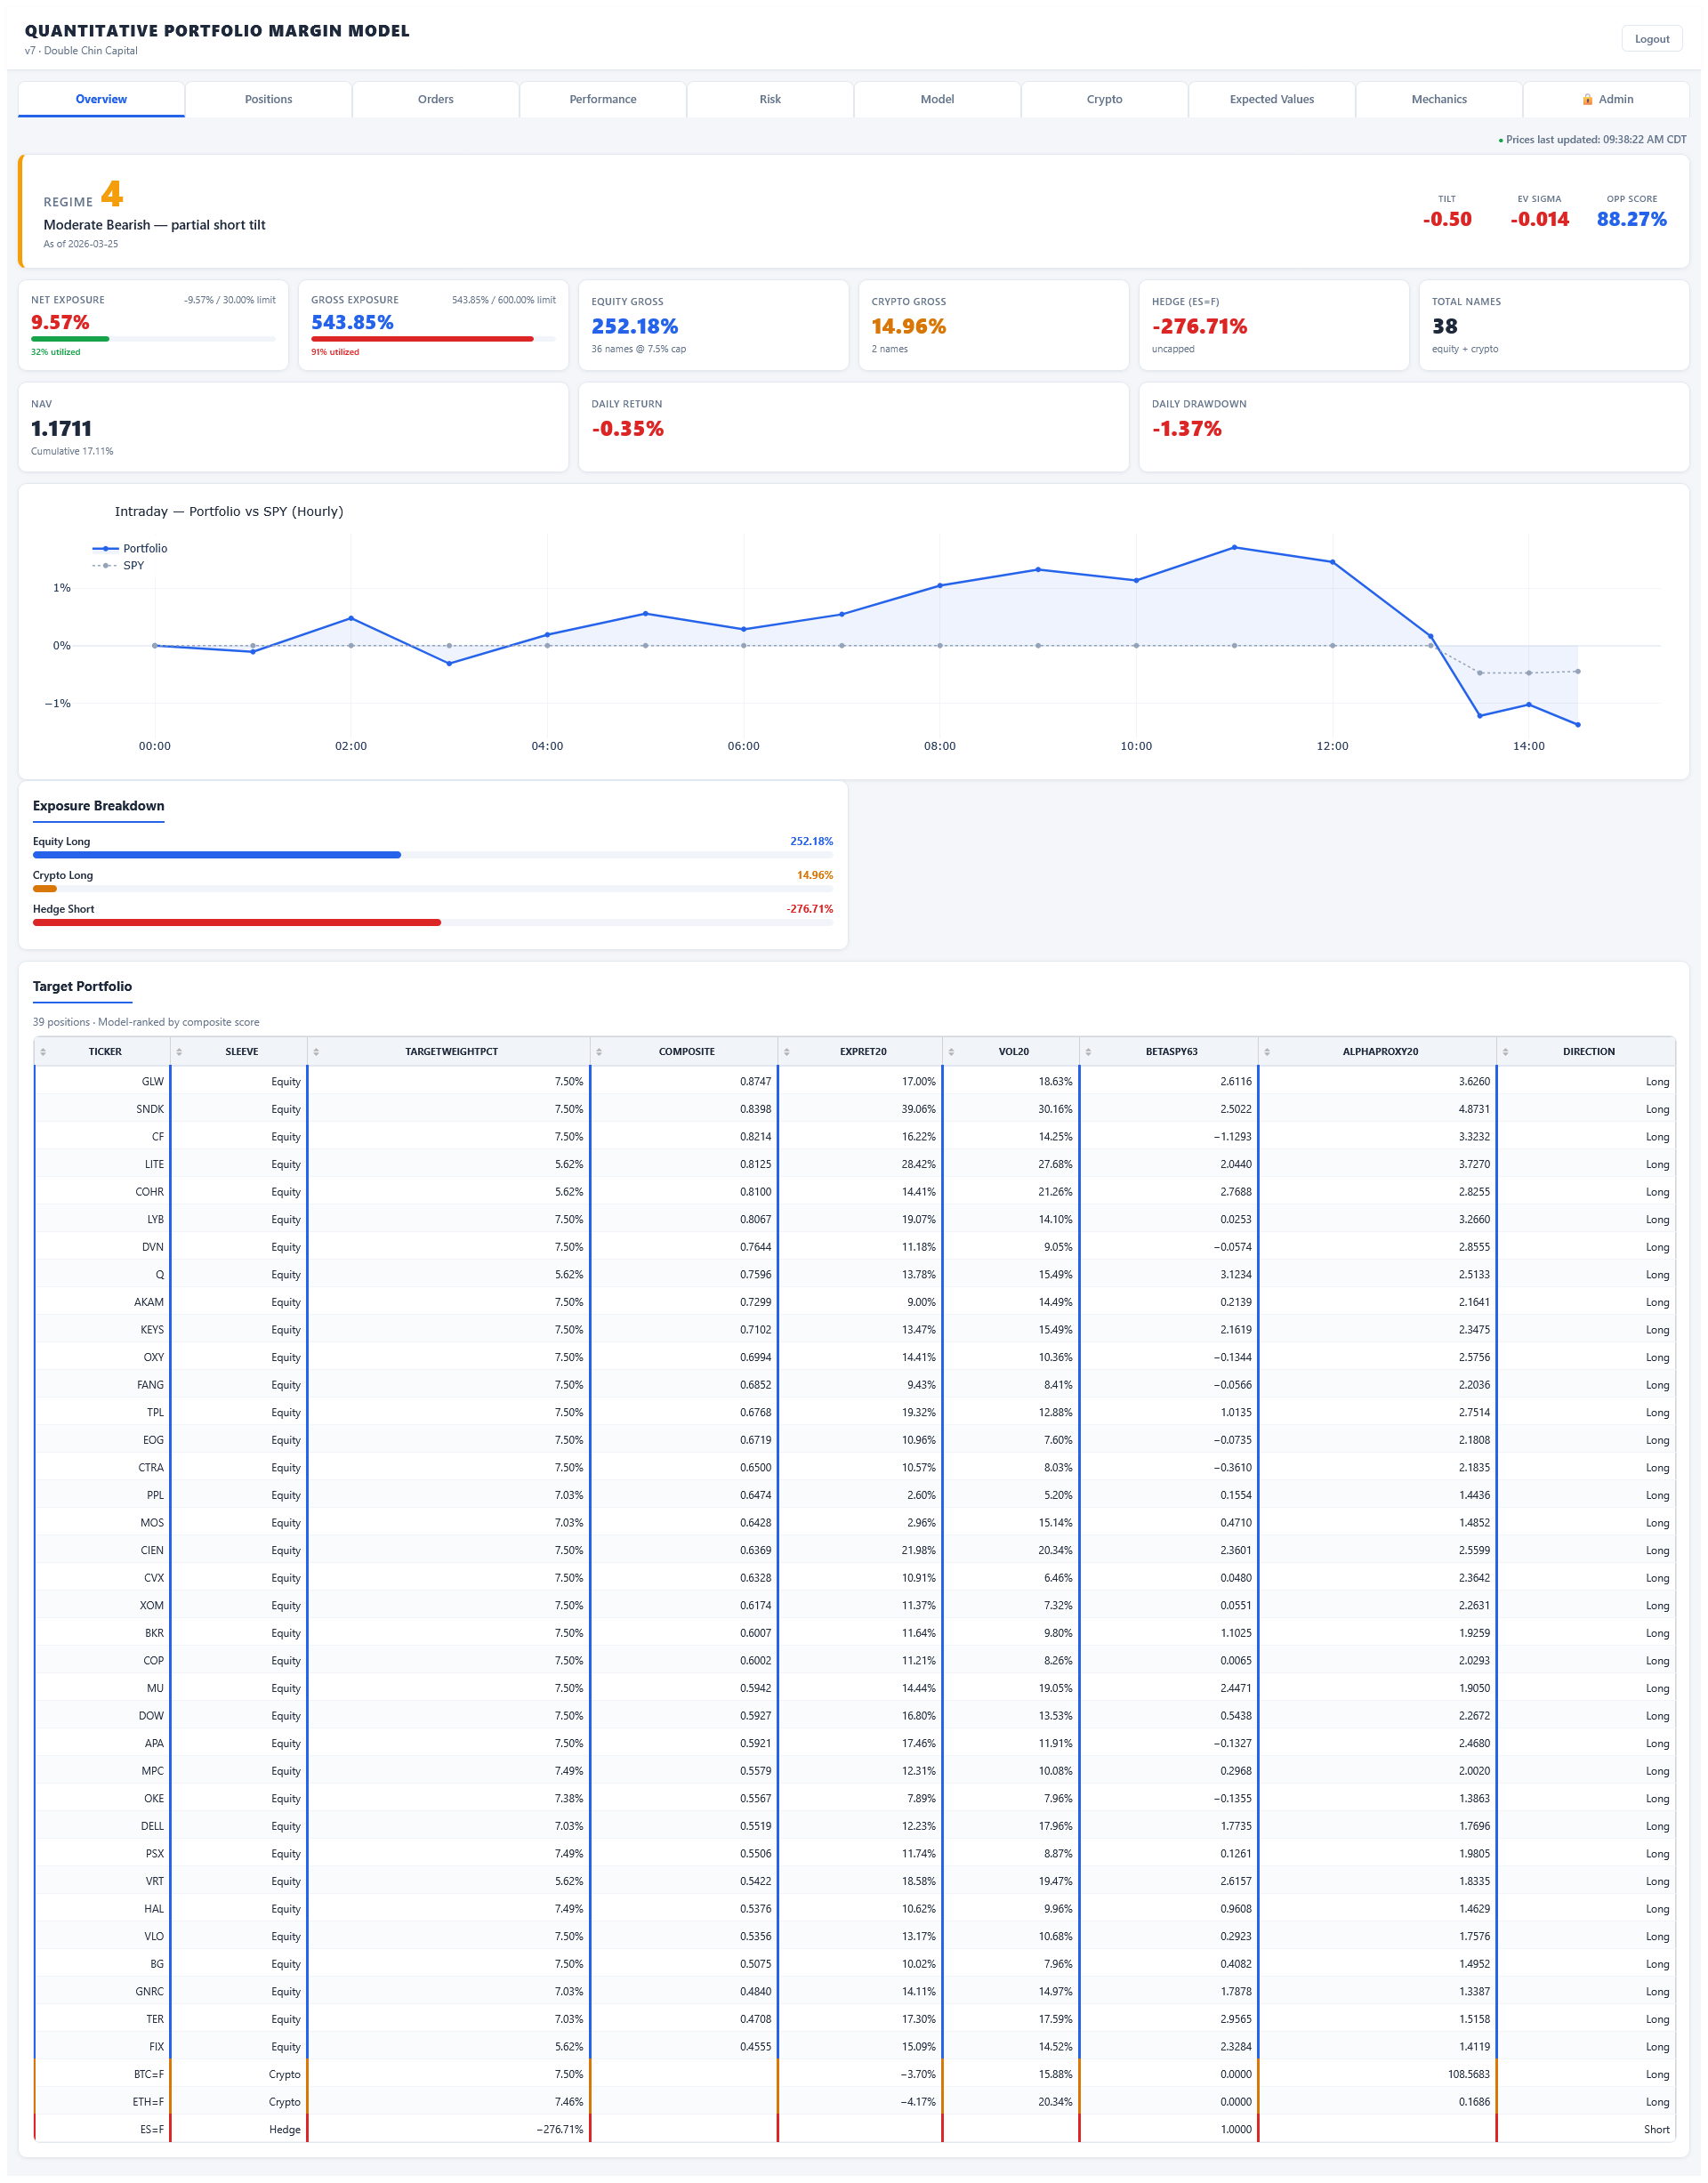
Overview
Live regime state with tilt, EV sigma, and opportunity score. Net and gross exposure gauges with utilization limits. NAV with cumulative return, daily return, and drawdown. Intraday portfolio vs SPY chart, exposure breakdown across equity long, crypto long, and hedge short, plus the full target portfolio ranked by composite score with expected return, volatility, beta, and alpha metrics.
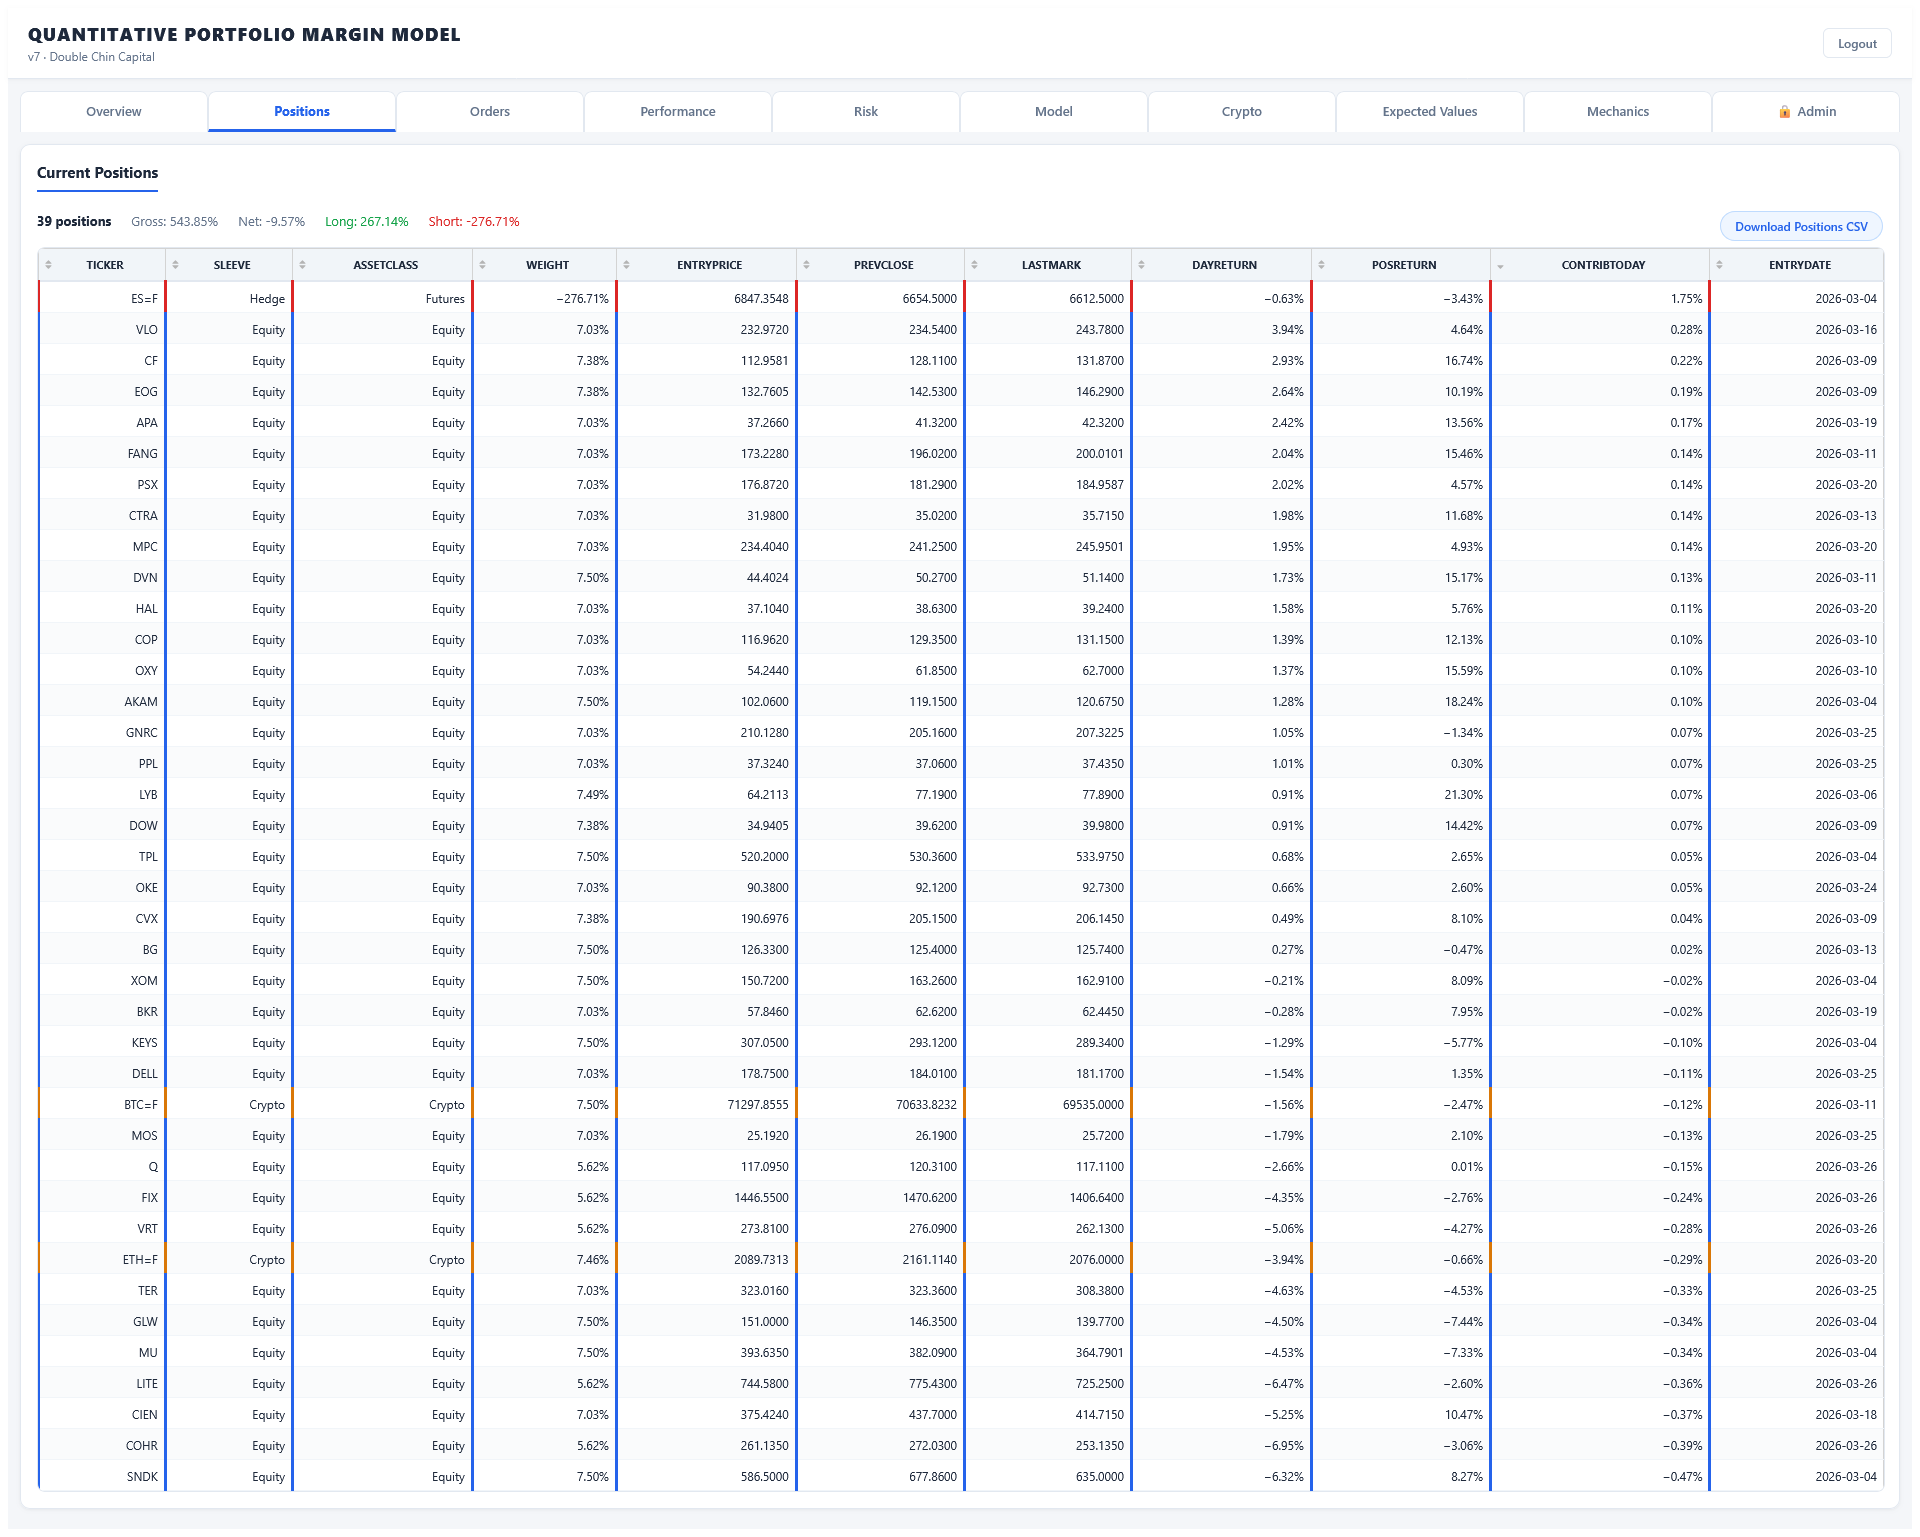
Positions
All 39 active positions across equity, crypto, and hedge sleeves. Entry price, previous close, live mark, daily and position return, daily contribution, and entry date for every name. Gross, net, long, and short exposure summary at the top.
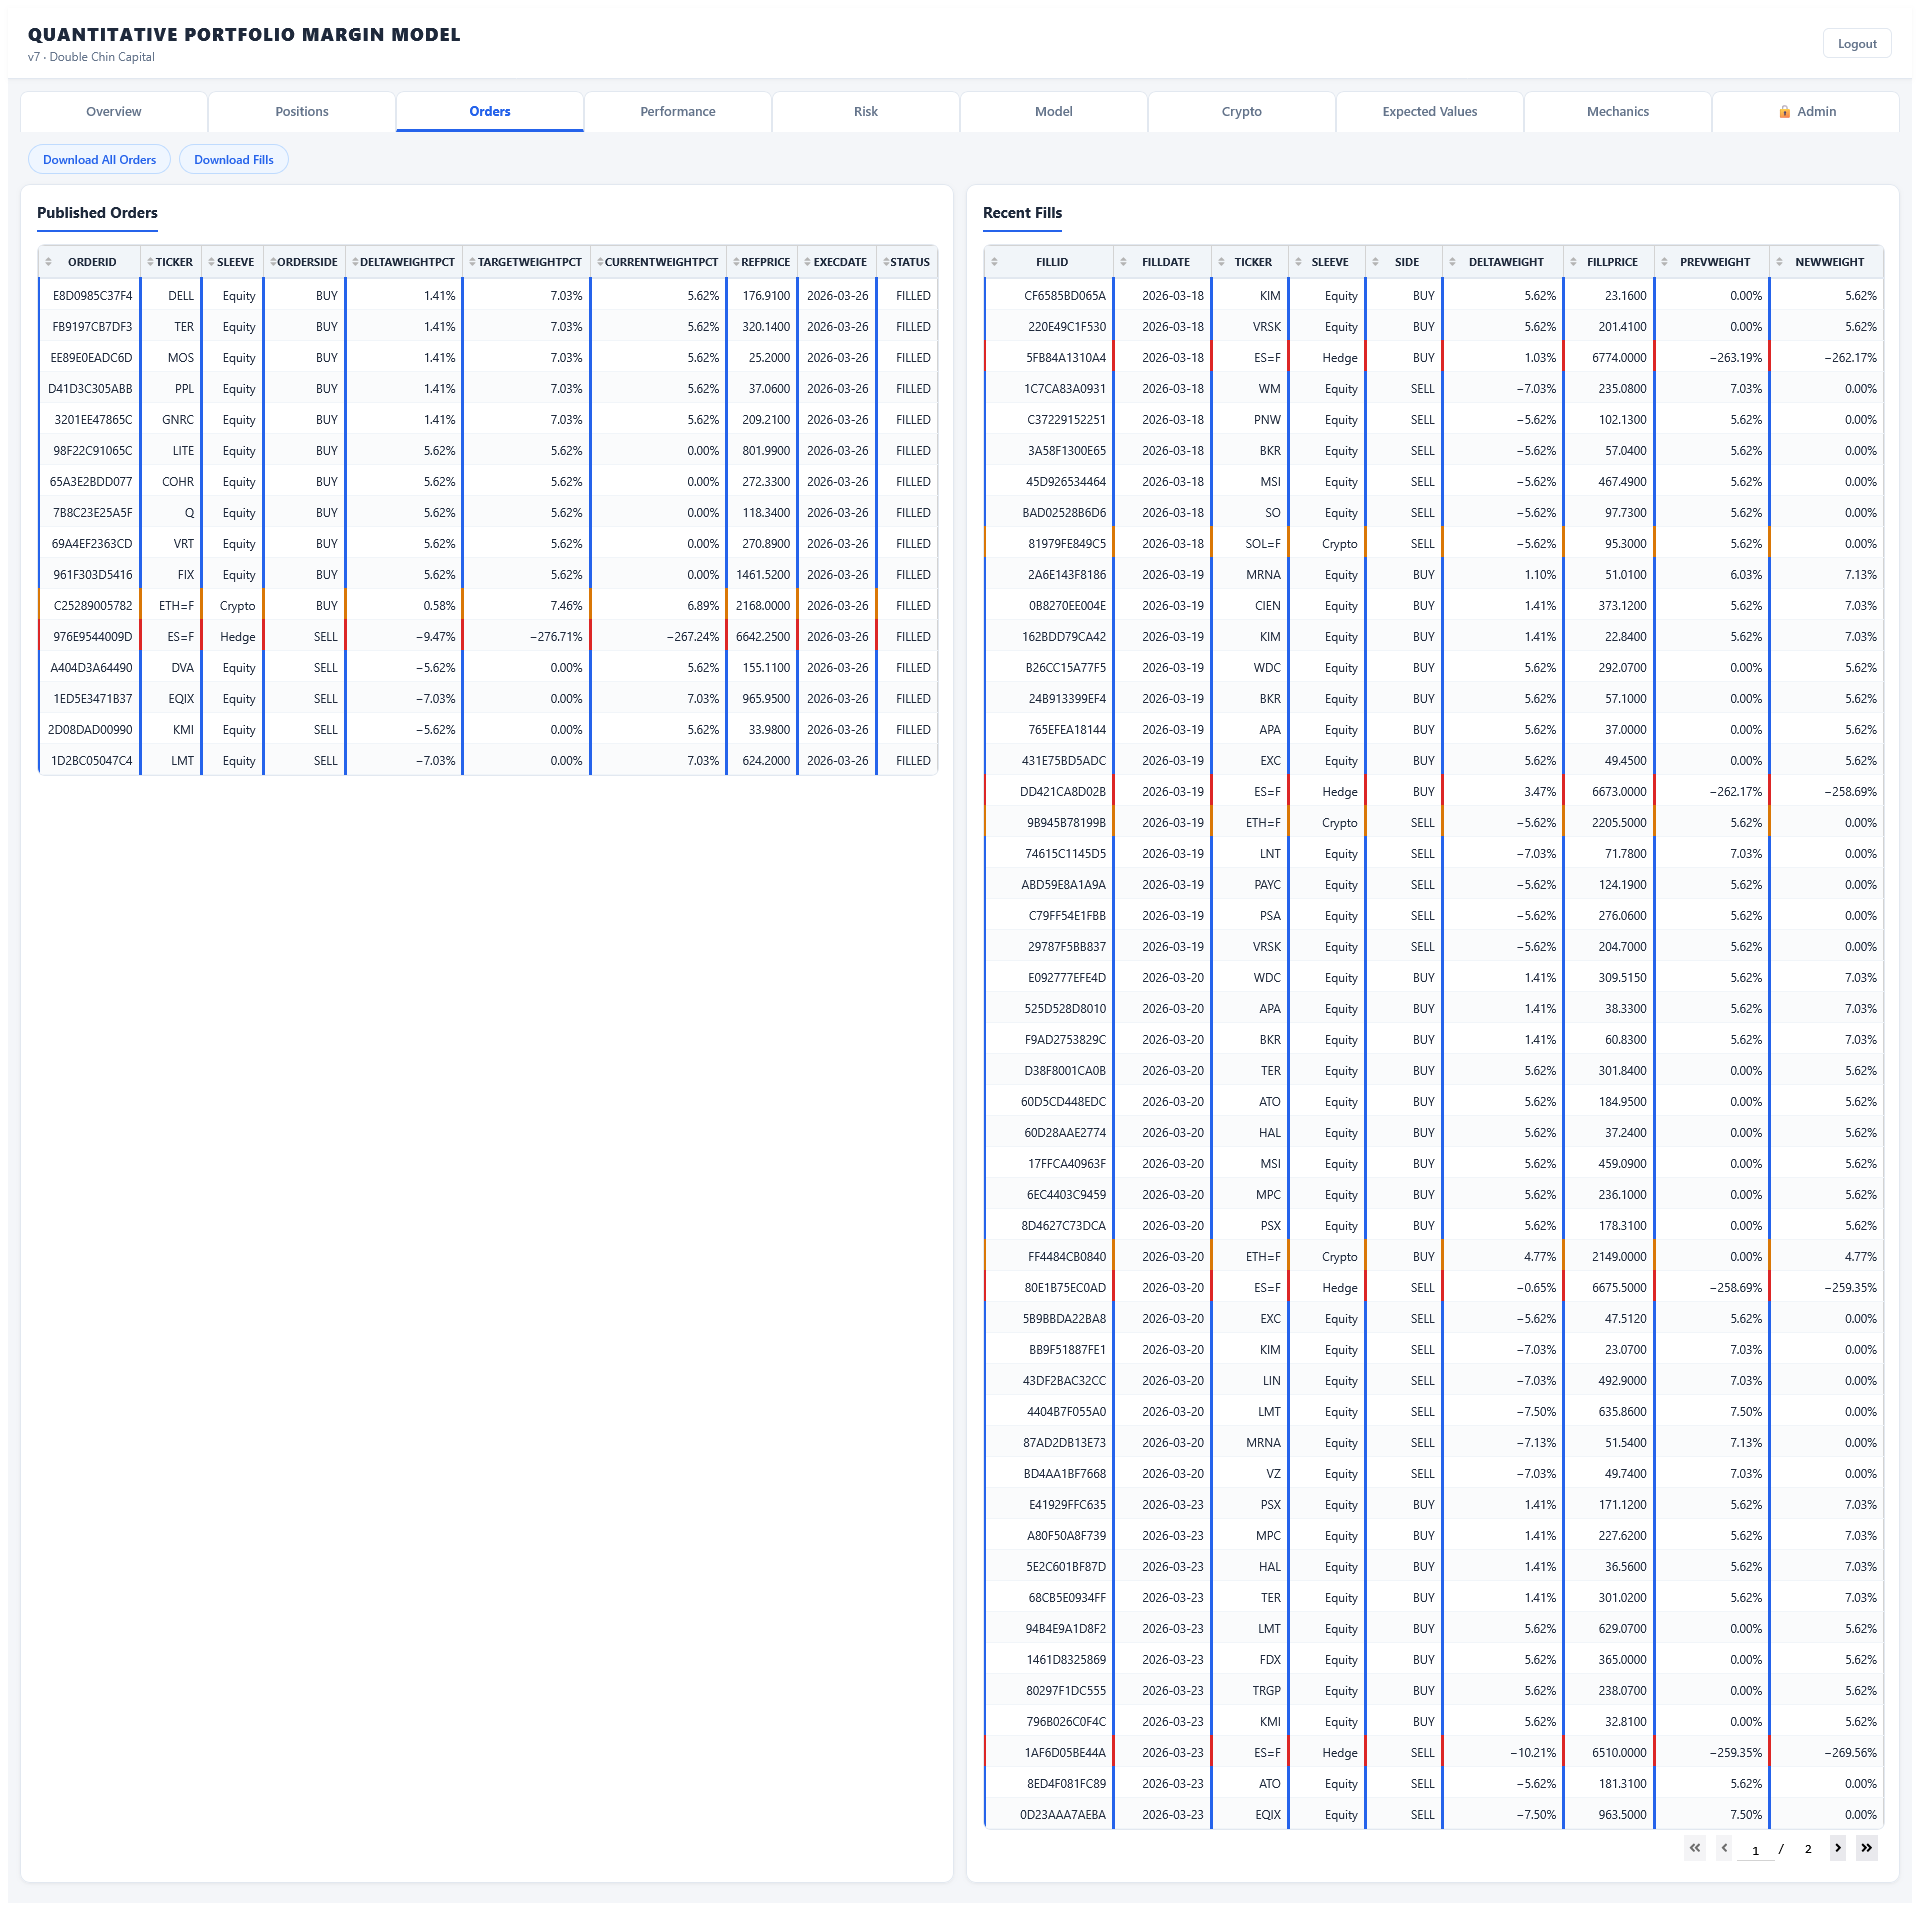
Orders
Published orders with ticker, sleeve, side, delta weight, target weight, and execution status. Recent fills panel showing fill price, previous and new weight. Downloadable as CSV for execution tracking.
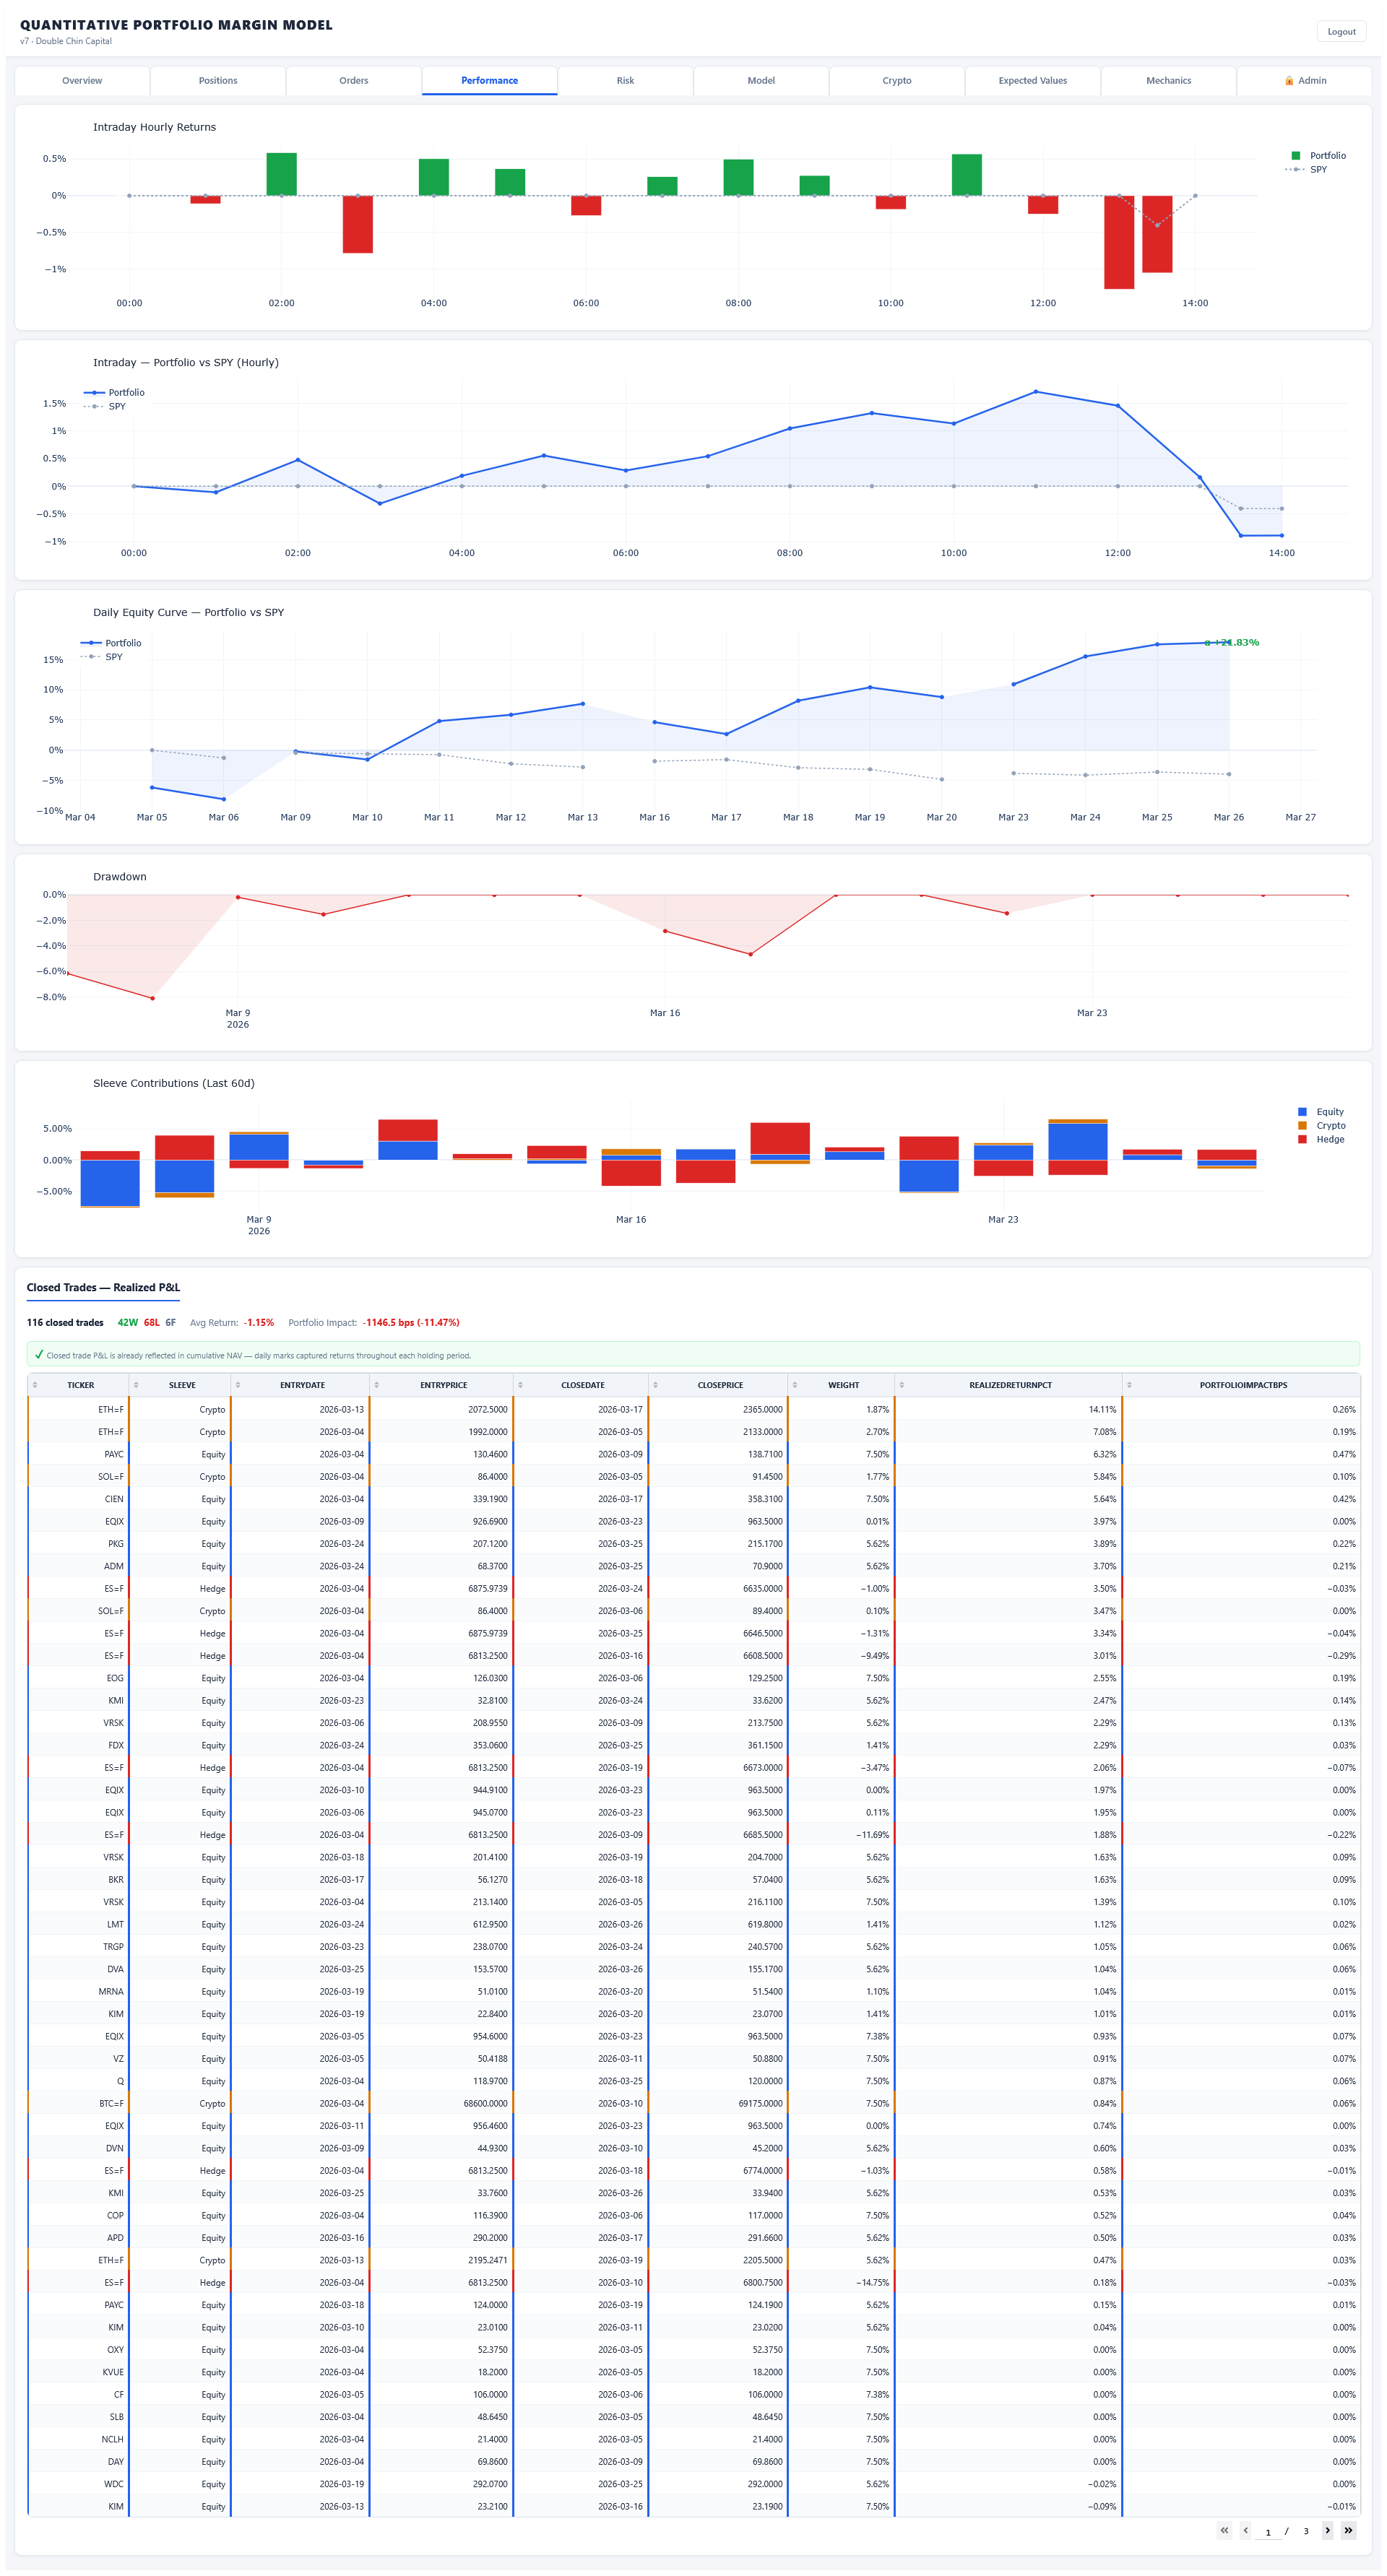
Performance
Intraday hourly return bars, intraday portfolio vs SPY line chart, daily equity curve over the full history, drawdown depth chart, sleeve contributions (equity, crypto, hedge) over the last 60 days, and a complete closed trades table with realized P&L and portfolio impact.
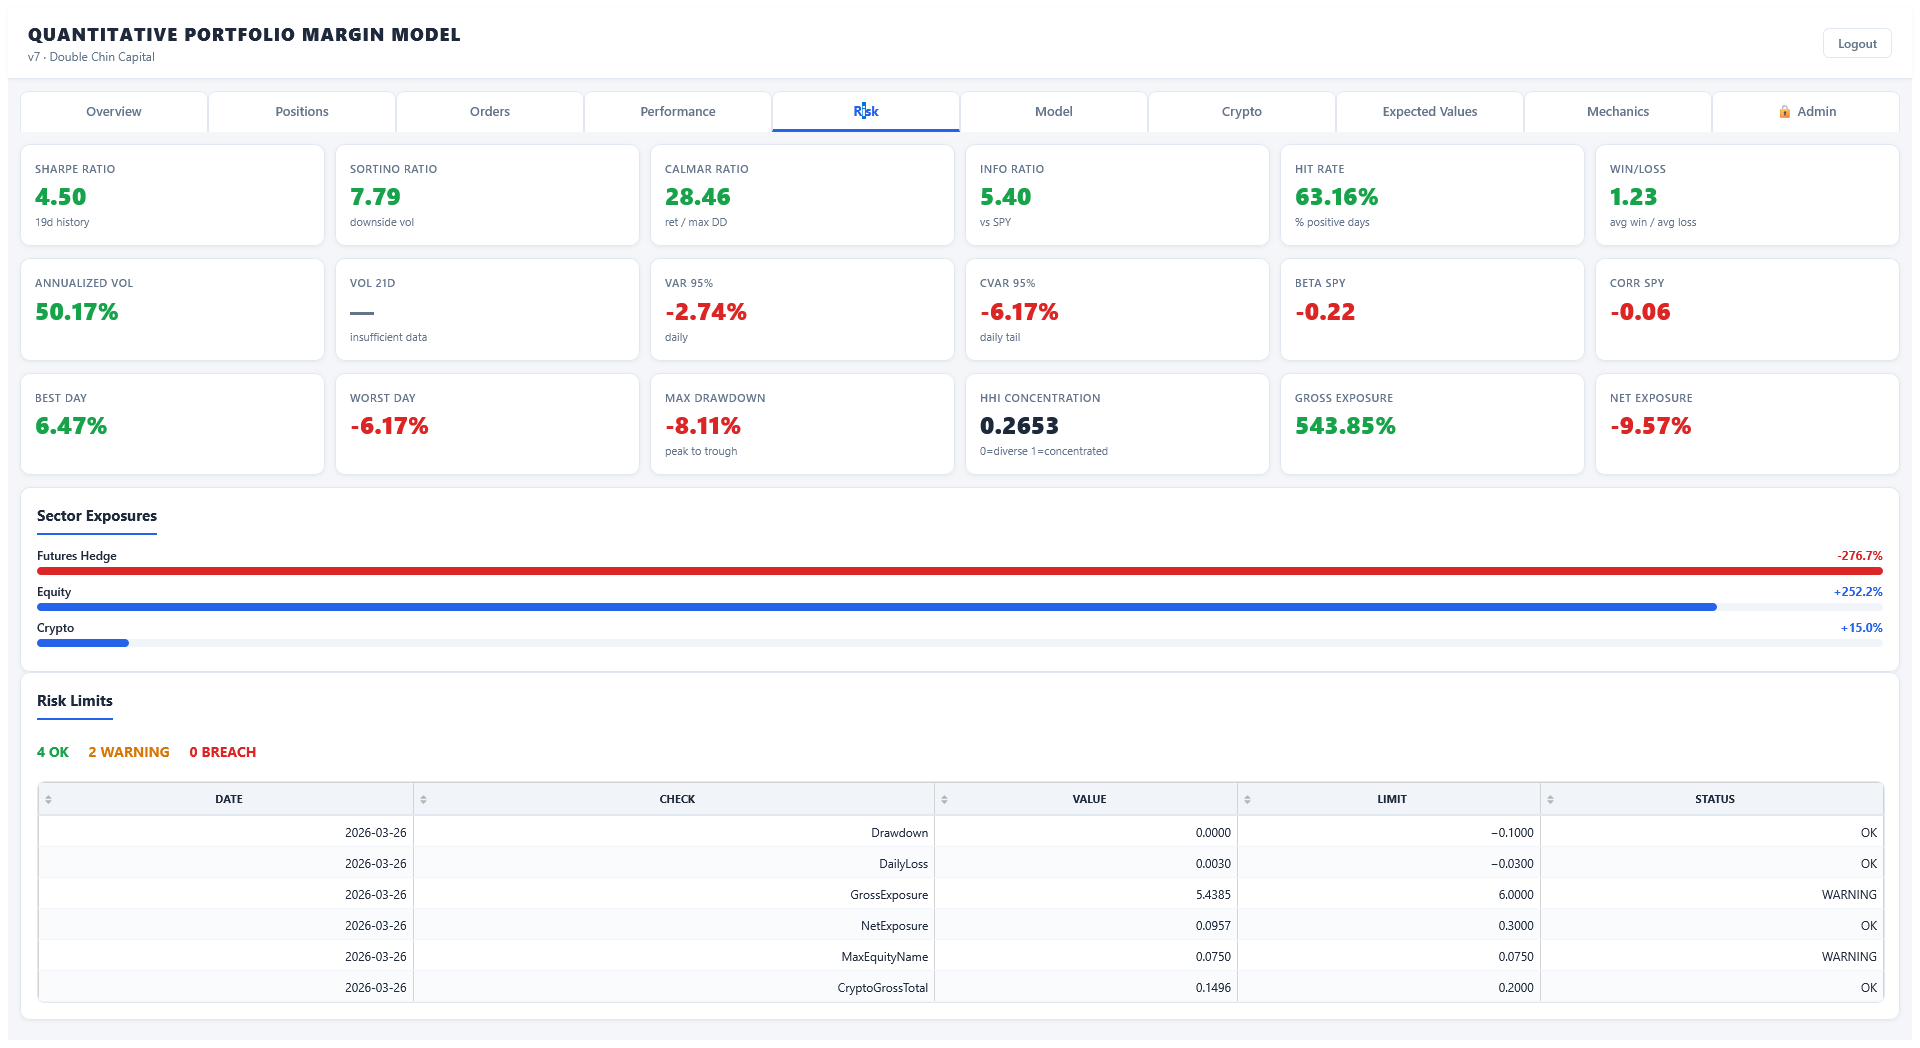
Risk
Full risk dashboard with Sharpe, Sortino, Calmar, and information ratios. VaR and CVaR at 95%, annualized volatility, beta and correlation to SPY, hit rate, win/loss ratio, best/worst day, max drawdown, and HHI concentration. Sector exposure bars and a live risk limits monitor with OK, warning, and breach status.
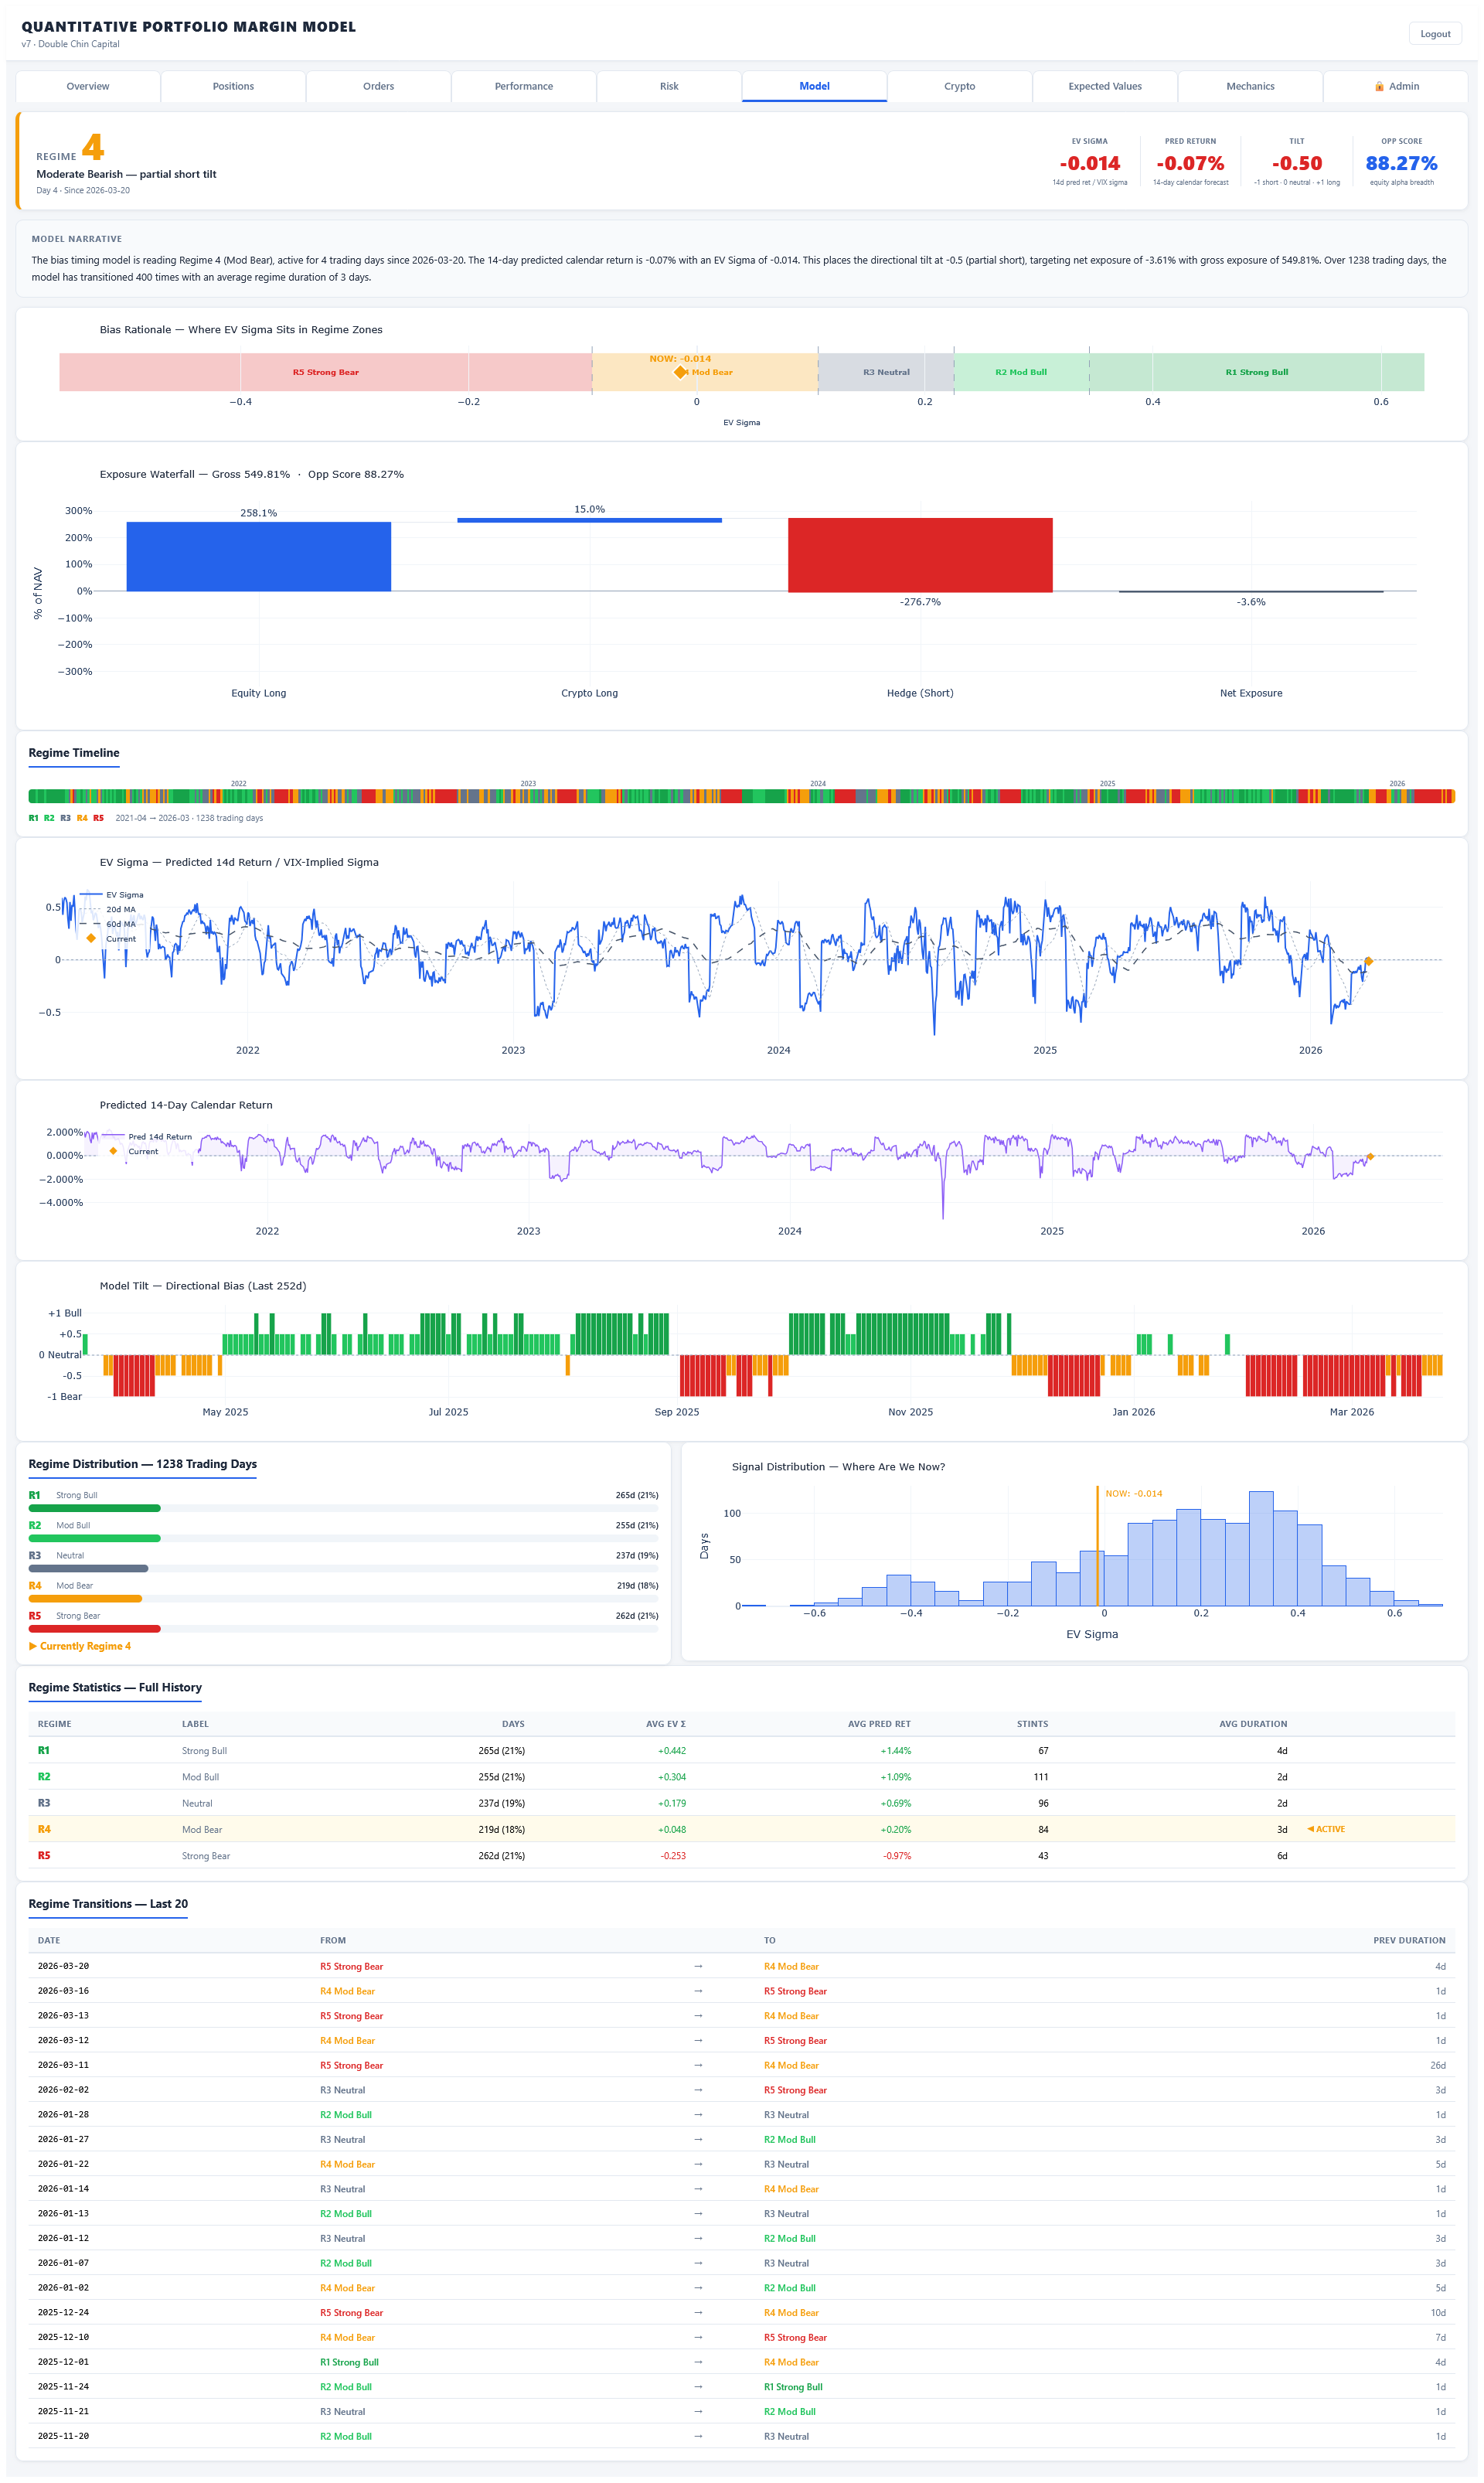
Model
Current regime state with narrative explanation, bias rationale across EV sigma zones, exposure waterfall, full regime timeline color-coded across history, EV sigma and predicted 14-day return charts, directional tilt over the last 252 days, regime distribution statistics, signal distribution scatter plot, and complete regime transition history.
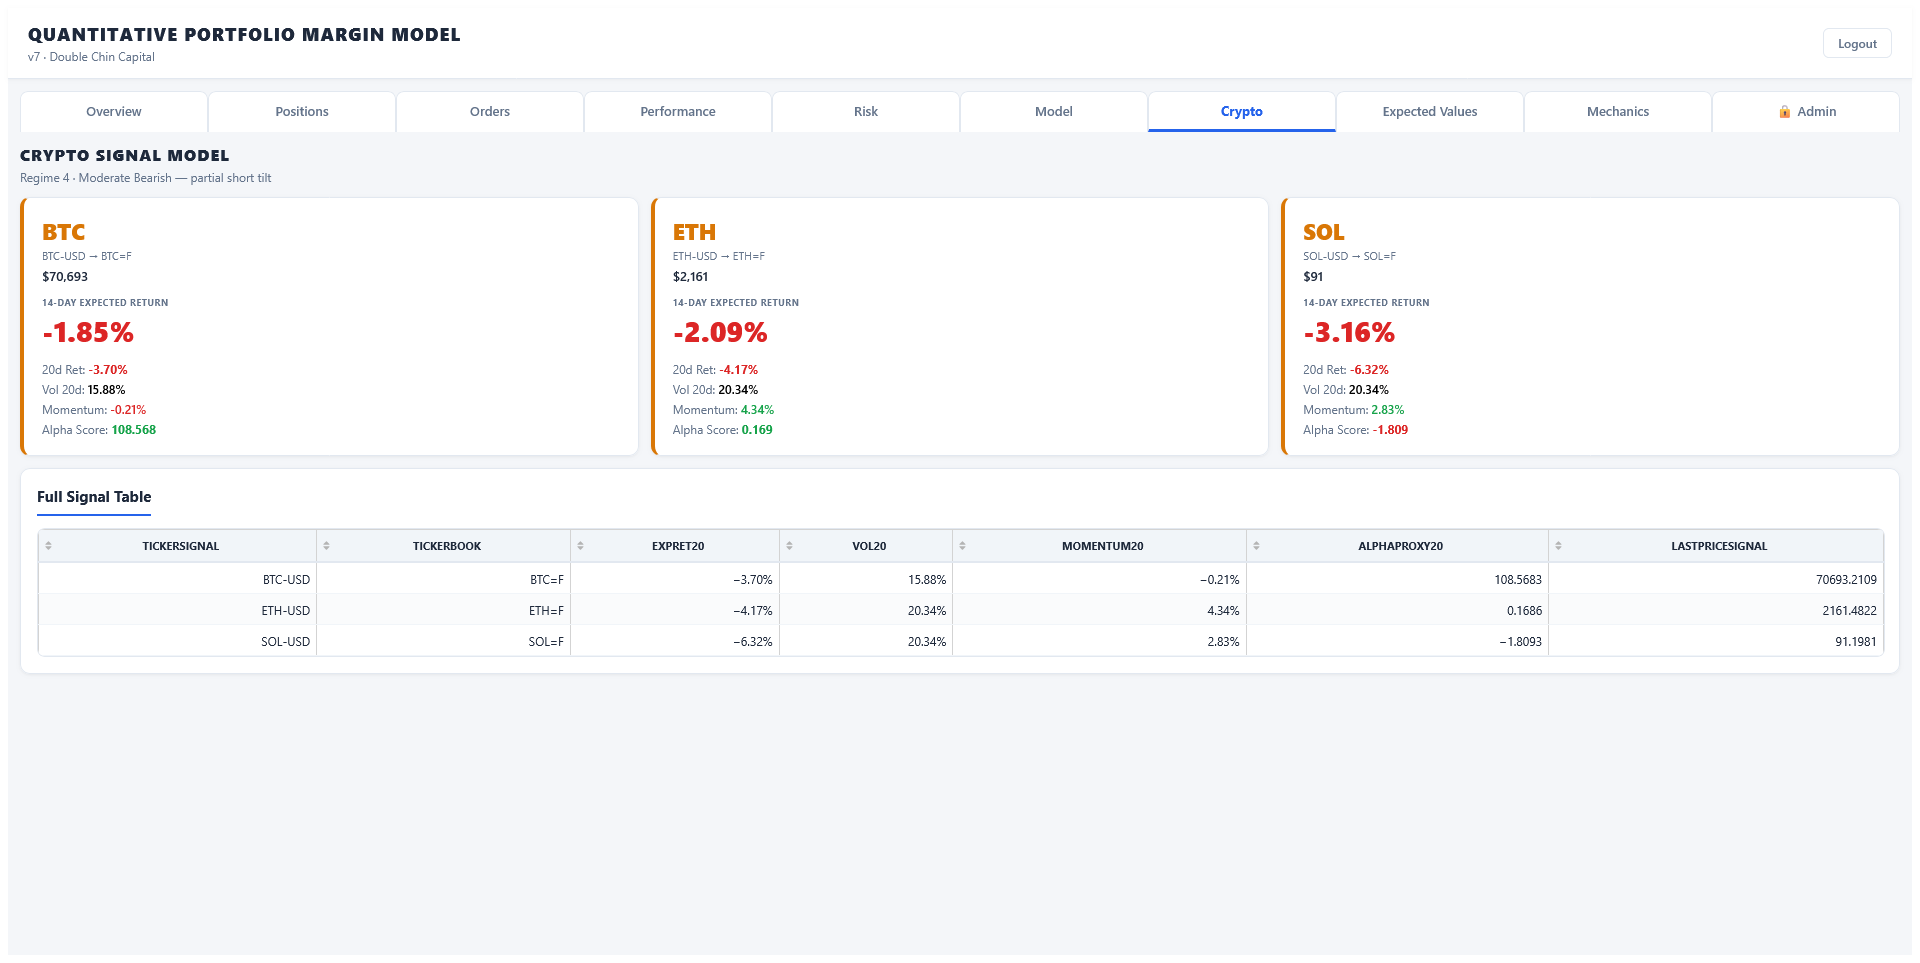
Crypto
Dedicated crypto signal model showing BTC, ETH, and SOL with live price, 14-day expected return, 20-day return, volatility, momentum, and alpha score. Full signal table mapping spot tickers to futures instruments with all scoring metrics.
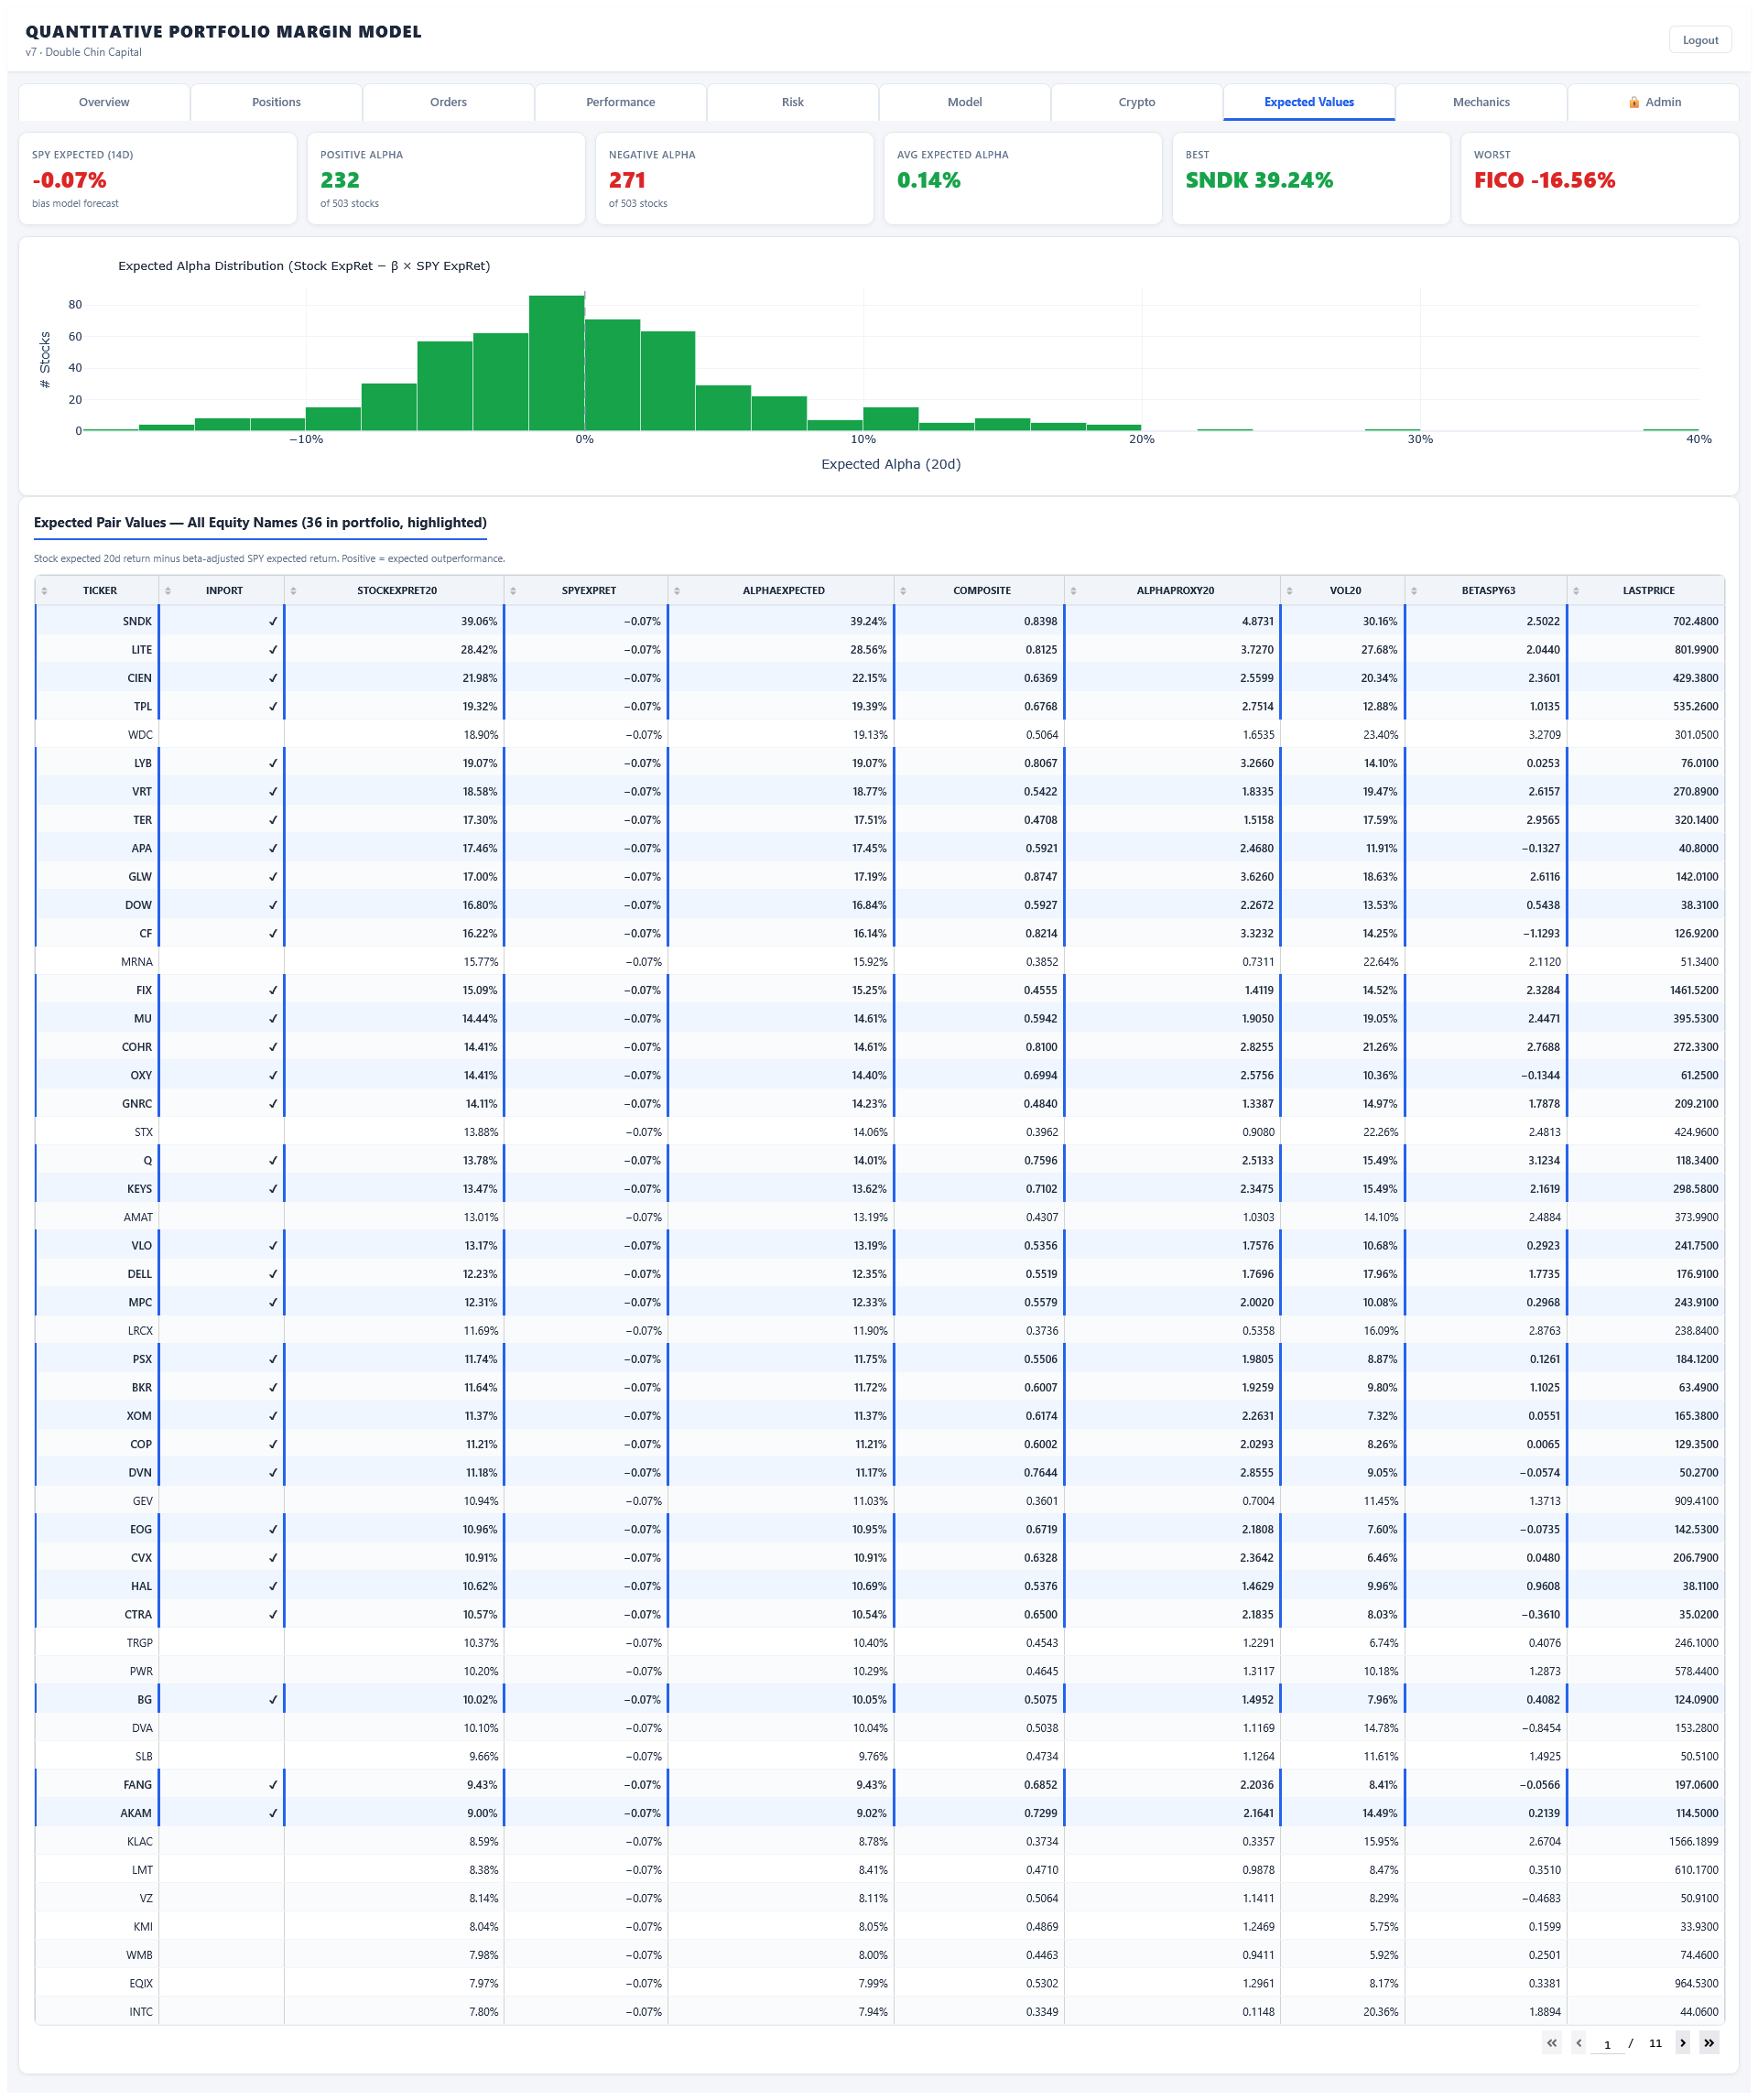
Expected Values
SPY 14-day expected return, count of positive and negative alpha names, best and worst expected performers. Expected alpha distribution histogram across the full S&P 500 universe. Complete ranked table of all equity names with stock expected return, beta-adjusted alpha, composite score, volatility, and current price.
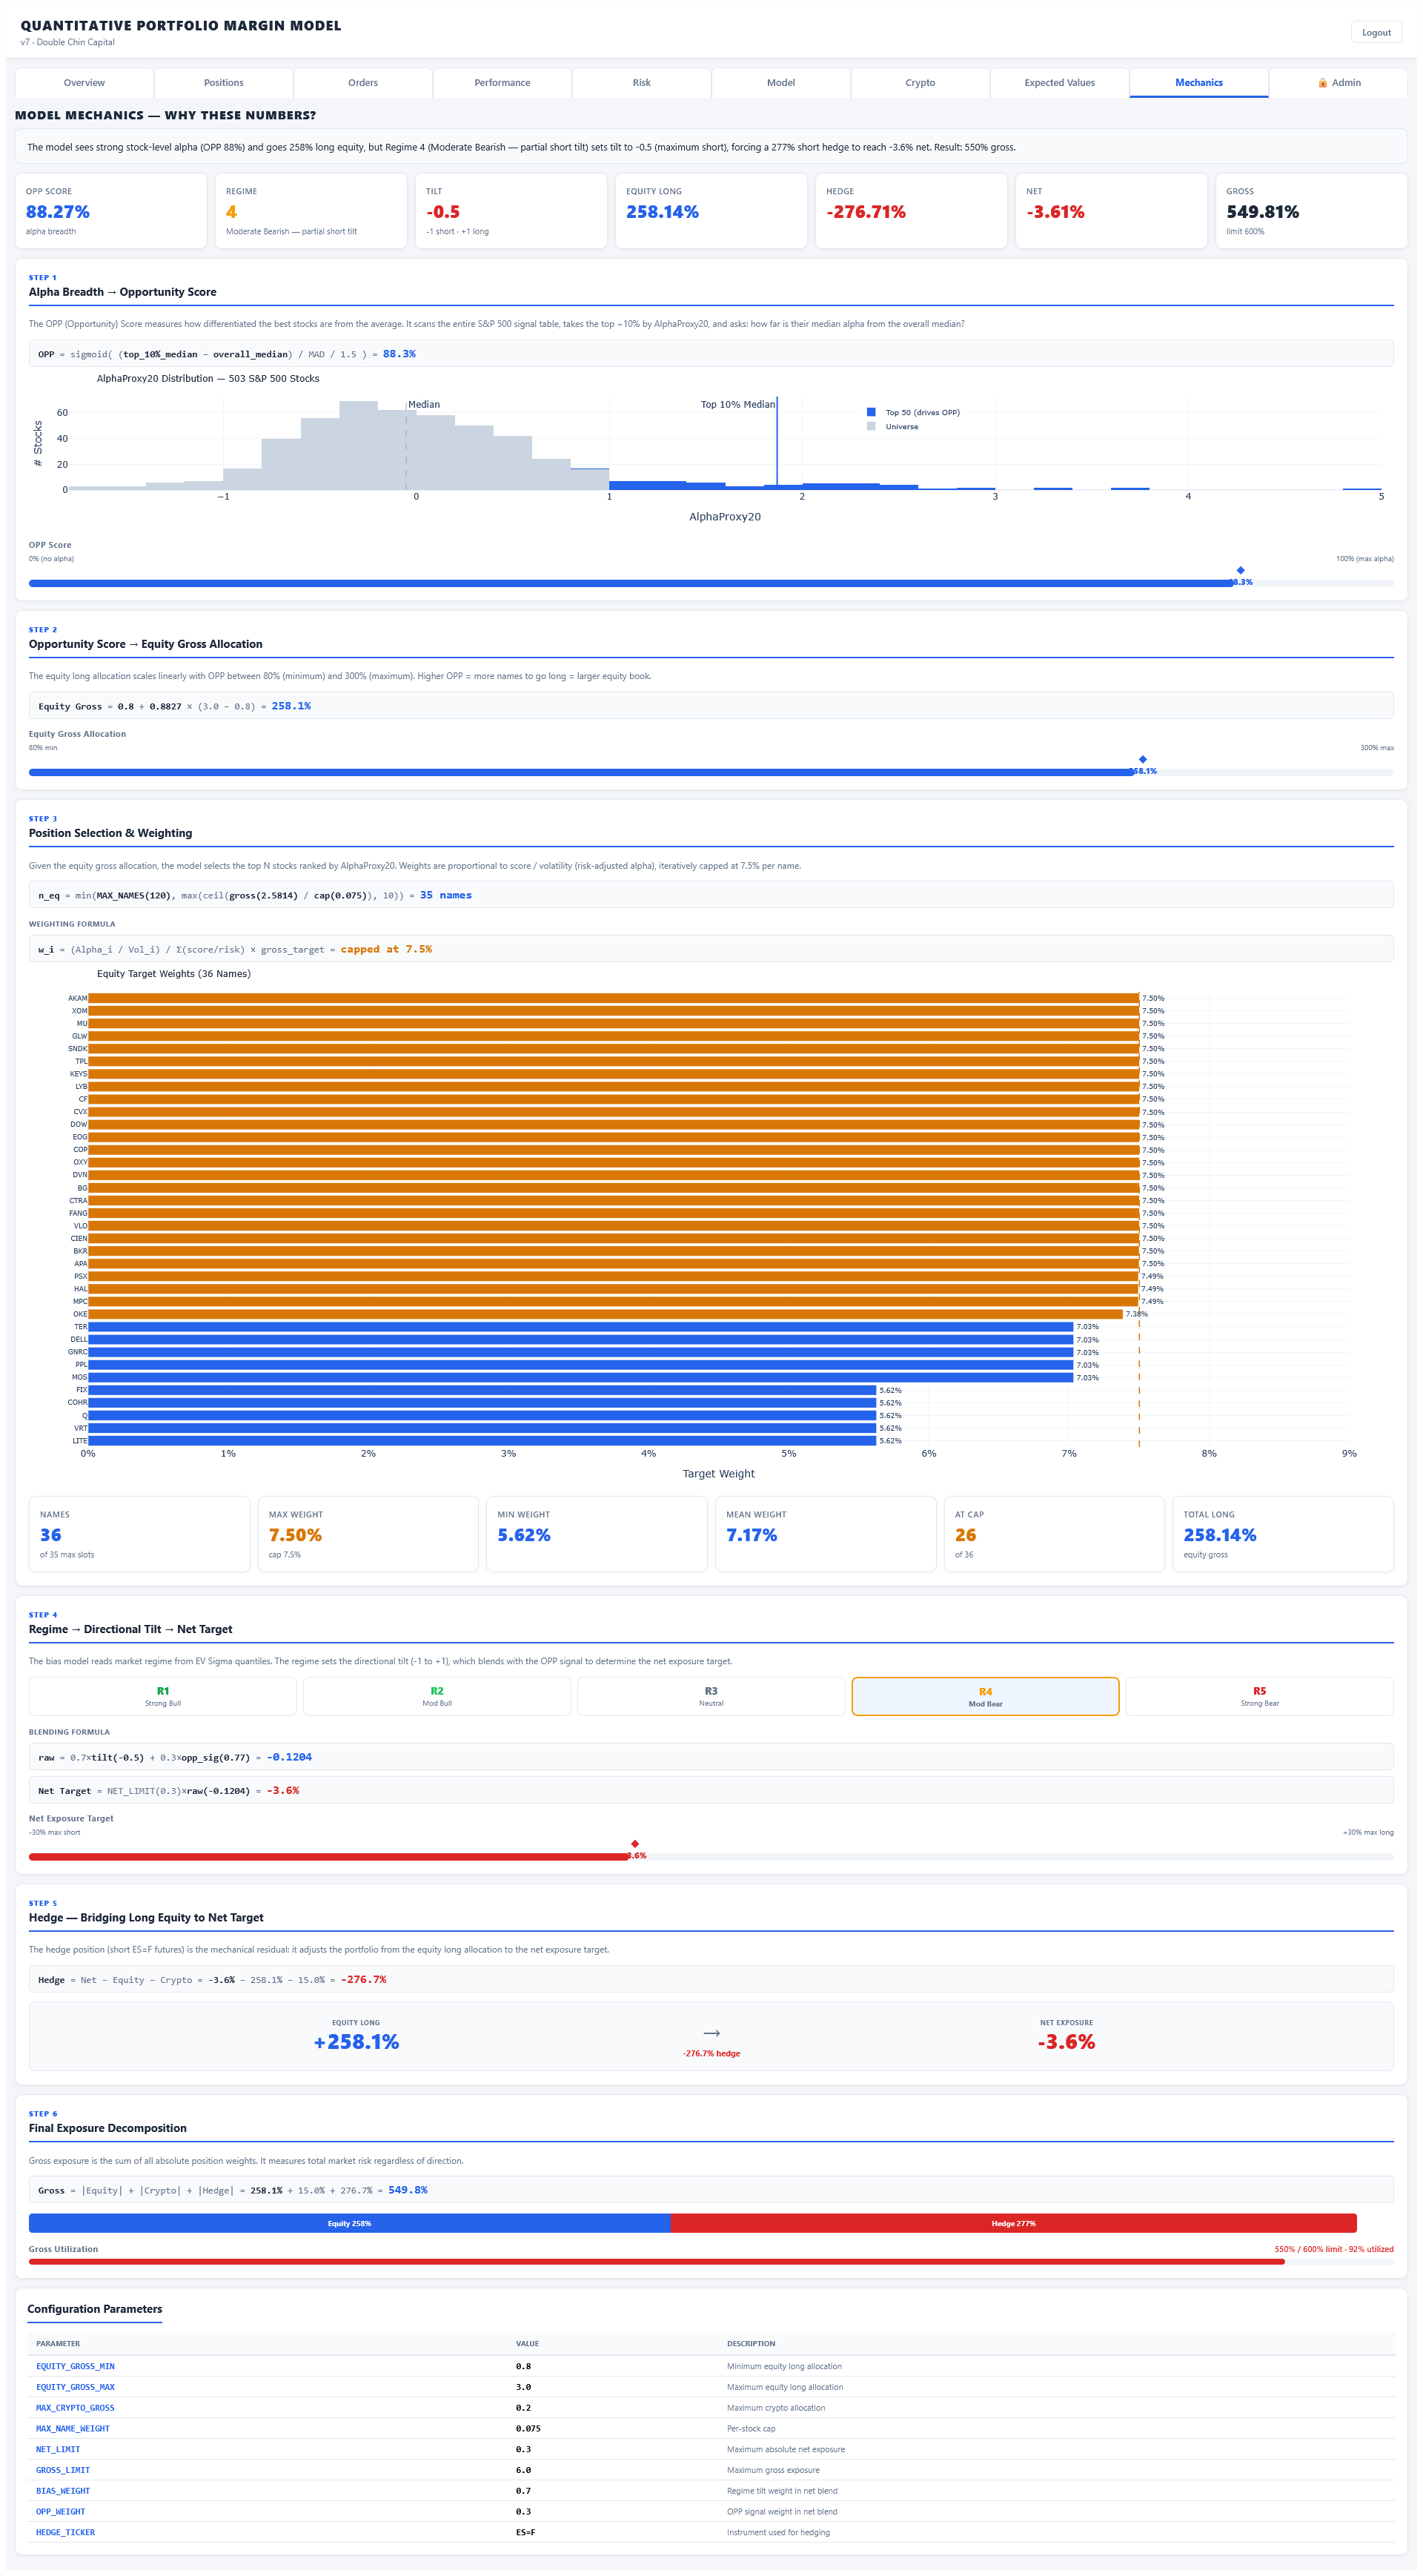
Mechanics
Step-by-step walkthrough of every model decision: alpha breadth and opportunity score calculation, opportunity score to equity gross allocation mapping, position selection and weighting formula with target weight distribution, regime-driven directional tilt to net exposure target, hedge sizing bridging long equity to net target, final exposure decomposition, and all configuration parameters.